Body composition is defined as the proportion of fat, muscle, bone, and water that makes up your total body weight, and it tells you far more about your health than a number on a scale ever can. The case for why tracking body composition beats weight comes down to one simple fact: two people can weigh exactly the same and have completely different health profiles. A DEXA scan, a bioelectrical impedance analysis (BIA) scale, or even skinfold calipers can reveal what a standard scale hides. According to Harvard Health, overweight in men starts at 25% body fat and in women at 36%, thresholds that weight alone cannot detect. That gap between what a scale shows and what your body actually contains is exactly where the benefits of body composition tracking become undeniable.
Why body composition beats weight for health risk assessment
Weight and BMI are blunt instruments. They measure mass, not metabolic risk. A study of roughly 15,000 adults found that waist circumference predicts metabolic syndrome risk more accurately than BMI, effectively canceling out BMI's predictive power when both are measured together. That finding matters because it means where fat sits in your body outranks how much you weigh when it comes to predicting disease.
The "skinny-fat" phenomenon makes this concrete. A person with a normal BMI can still carry dangerous levels of visceral fat, the deep abdominal fat wrapped around organs. Visceral fat accumulates despite a normal BMI, raising the risk of type 2 diabetes and cardiovascular disease without triggering any alarm on a standard scale. A doctor relying only on weight or BMI would miss this entirely.

Body composition testing adds the metrics that standard medical exams skip. Detailed fat, lean mass, and visceral fat data reveal risks that weight measurement alone cannot surface. This is why clinical action guided by body composition differs so drastically from action guided by weight. Treating a patient based on their scale number while ignoring fat distribution is like diagnosing a car problem by checking only the fuel gauge.
Pro Tip: If you track waist circumference alongside body fat percentage, you get a clearer picture of visceral fat risk than either metric provides on its own. Measure at the navel, relaxed, once a week.
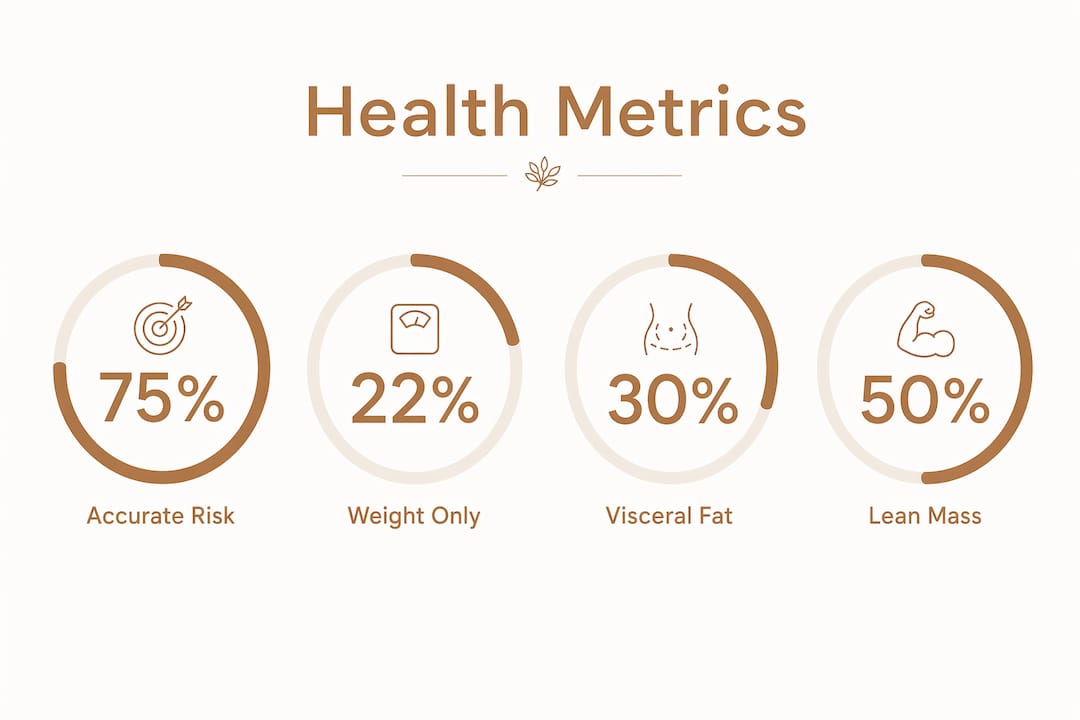
Comparing health metrics: what each measurement actually tells you
| Metric | What It Measures | Health Risk Detected | Key Limitation |
|---|---|---|---|
| Body weight | Total mass | None directly | Ignores fat vs. muscle ratio |
| BMI | Weight relative to height | Rough obesity category | Misclassifies muscular individuals |
| Body fat percentage | Fat as share of total mass | Obesity, metabolic risk | Varies by measurement method |
| Waist circumference | Abdominal fat distribution | Visceral fat, metabolic syndrome | Does not distinguish fat types |
| DEXA scan | Fat, lean mass, bone density by region | Precise regional fat and muscle | Cost and access barriers |
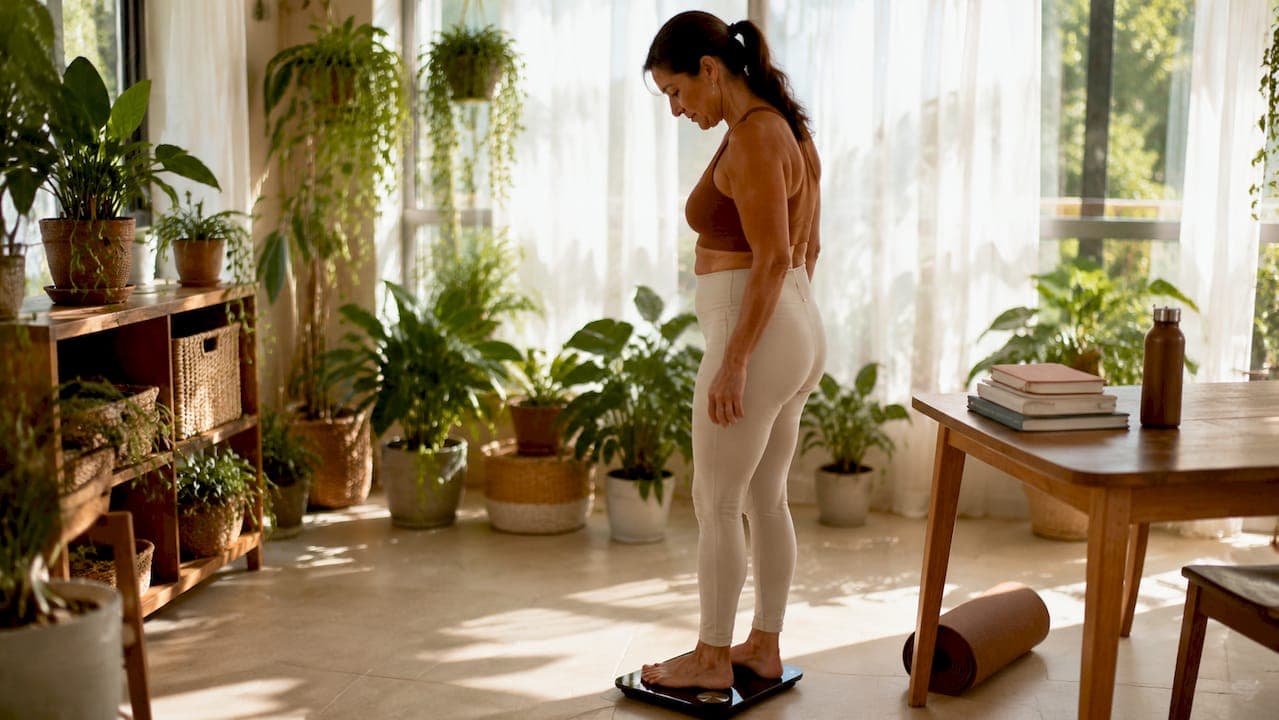
Why the scale lies during body recomposition
Body recomposition is the process of simultaneously losing fat and gaining muscle. It is the goal of most people who train seriously, and it is also the fastest way to lose trust in your bathroom scale. Recomposition can keep total weight unchanged over 12 weeks even as your body fat drops and lean mass increases. The scale reads the same. Your body looks and performs completely differently.
This is one of the most common sources of frustration in fitness. Someone trains consistently for two months, eats well, and sees zero movement on the scale. Without body composition data, that person often concludes the program is not working and quits. With body composition data, they see that they lost four pounds of fat and gained four pounds of muscle. That is a meaningful result hidden by a single number.
Rapid weight changes after intense workouts add another layer of confusion. Scale fluctuations after exercise mostly reflect glycogen depletion and water shifts, not fat loss. A hard leg day can drop your scale weight by two pounds overnight. A high-carb meal can add it back. Neither change has anything to do with your actual fat stores.
Here is what to track instead of obsessing over daily weight:
- Body fat percentage trend over 4–8 weeks, not day to day
- Lean mass trend to confirm muscle is being preserved or built
- Waist and hip measurements as a low-tech visceral fat proxy
- Progress photos taken under consistent lighting and angles
- Performance markers like strength gains or endurance improvements
Pro Tip: Combine a fitness tracking workflow with your BIA scale readings. Log workouts alongside composition data so you can connect training stimulus to body changes over time.
How do the main body composition methods compare?
The advantages of measuring body composition depend heavily on which method you use. Each tool sits at a different point on the accuracy-versus-convenience spectrum, and the right choice depends on your goals and budget.
DEXA scan is the gold standard. It uses low-dose X-ray to measure fat mass, lean mass, and bone density by body region. DEXA precision error runs about 1.5%, which makes it ideal for benchmarking at the start and end of a training block. At $50–$150 per scan, it is not practical for weekly tracking. Use it quarterly to set baselines and confirm long-term trends.
BIA scales (bioelectrical impedance analysis) send a small electrical current through the body and estimate composition based on resistance. They are affordable, fast, and available for home use. Devices like the Uvirello Smart Electronic Weight Scale deliver body fat percentage, BMI, and other metrics in seconds. The trade-off is that BIA accuracy shifts with hydration, food intake, and time of day. The solution is consistency, not perfection.
Skinfold calipers measure subcutaneous fat at specific body sites. In skilled hands, they are reasonably accurate and very cheap. The problem is that accuracy depends entirely on the technician's technique. Results vary between testers, making trend tracking unreliable unless the same person measures you every time.
Measurement method comparison
| Method | Accuracy | Cost per Test | Convenience | Best Use Case |
|---|---|---|---|---|
| DEXA scan | Very high (~1.5% error) | $50–$150 | Low (clinic visit) | Quarterly benchmarking |
| BIA scale | Moderate | $0 (after purchase) | Very high (home use) | Daily or weekly trend tracking |
| Skinfold calipers | Moderate (skill-dependent) | Low | Moderate | Budget tracking with consistent tester |
| Hydrostatic weighing | High | $40–$100 | Low (facility needed) | Periodic research-grade assessment |
How to apply body composition data to real fitness goals
Tracking body composition effectively starts with a baseline. Take your first measurement before changing anything about your diet or training. This number is not a judgment. It is a starting coordinate. Without it, you cannot measure progress.
Set goals in terms of body fat percentage and lean mass, not pounds. "Lose 10 pounds" is a vague target that ignores whether you are losing fat, muscle, or water. "Reduce body fat from 28% to 23% while maintaining lean mass" is a specific, trackable goal that tells you exactly what your nutrition and training need to accomplish.
Use composition data to adjust your approach every 4–6 weeks. If lean mass is dropping, increase protein intake. If body fat is not moving, reassess your calorie balance. Body composition testing also provides basal metabolic rate (BMR) data, which makes caloric planning far more precise than generic online calculators. Pair this with tools like IoT-enabled health devices that sync composition data with your broader health metrics.
Follow these steps to build a reliable tracking routine:
- Establish your baseline. Take three BIA readings on consecutive mornings under identical conditions and average them.
- Set a measurement schedule. Weekly readings work for most people. Daily readings are fine if you focus on the 7-day rolling average, not individual data points.
- Standardize your conditions. Consistent BIA readings require measuring fasted, after using the bathroom, at the same time each day. Deviating from this protocol introduces noise.
- Log everything in one place. Record body fat percentage, lean mass, waist circumference, and workout data together. Patterns become visible when data lives in one system.
- Review trends, not snapshots. A single reading means almost nothing. A 6-week trend tells you whether your program is working.
Avoid the trap of overreacting to daily fluctuations. A one-day spike in body fat percentage after a salty dinner is water retention, not a fat gain event. Zoom out. The trend over weeks is the signal. Everything else is noise.
Key takeaways
Tracking body composition gives you the specific data needed to make real progress, while weight alone keeps you guessing.
| Point | Details |
|---|---|
| Weight hides critical health risks | Visceral fat and metabolic syndrome can develop at a normal body weight, undetected by scales. |
| Body fat percentage defines overweight more accurately | Overweight begins at 25% body fat for men and 36% for women, thresholds weight cannot reveal. |
| Recomposition makes the scale misleading | Fat loss and muscle gain can cancel out on the scale over 12 weeks despite real physical change. |
| Method choice determines tracking quality | DEXA scans benchmark quarterly; BIA scales track trends daily when used under consistent conditions. |
| Trends beat snapshots every time | Review 4–8 week composition trends rather than reacting to daily scale fluctuations. |
The number that actually tells you something
I have watched a lot of people quit programs that were working. They trained hard for six weeks, ate well, and stepped on the scale to find they had lost two pounds. Two pounds felt like failure. What the scale did not show was that they had lost six pounds of fat and gained four pounds of muscle. That is a transformation. The scale called it a disappointment.
The shift I keep recommending is simple: stop treating weight as the primary output of your fitness effort. Weight is a side effect. Body composition is the actual result. When you track fat percentage and lean mass, you stop chasing a number and start managing your physiology. That is a completely different relationship with your own health data.
The other thing I have noticed is that body composition data is motivating in a way that weight is not. Seeing your lean mass hold steady during a fat loss phase tells you your protein intake is working. Seeing visceral fat estimates drop tells you your metabolic health is improving. These are specific, meaningful signals. A scale just tells you gravity is still working.
Patience matters here. Body recomposition requires high protein intake, a slight calorie deficit, and progressive overload in training. None of that produces dramatic weekly scale changes. But over 12–16 weeks, the composition data tells a clear story. Commit to the trend, not the moment.
— Jacob
Track what actually moves the needle
If you are ready to move beyond guessing and start tracking the metrics that reflect real health progress, Uvirello makes that shift straightforward.
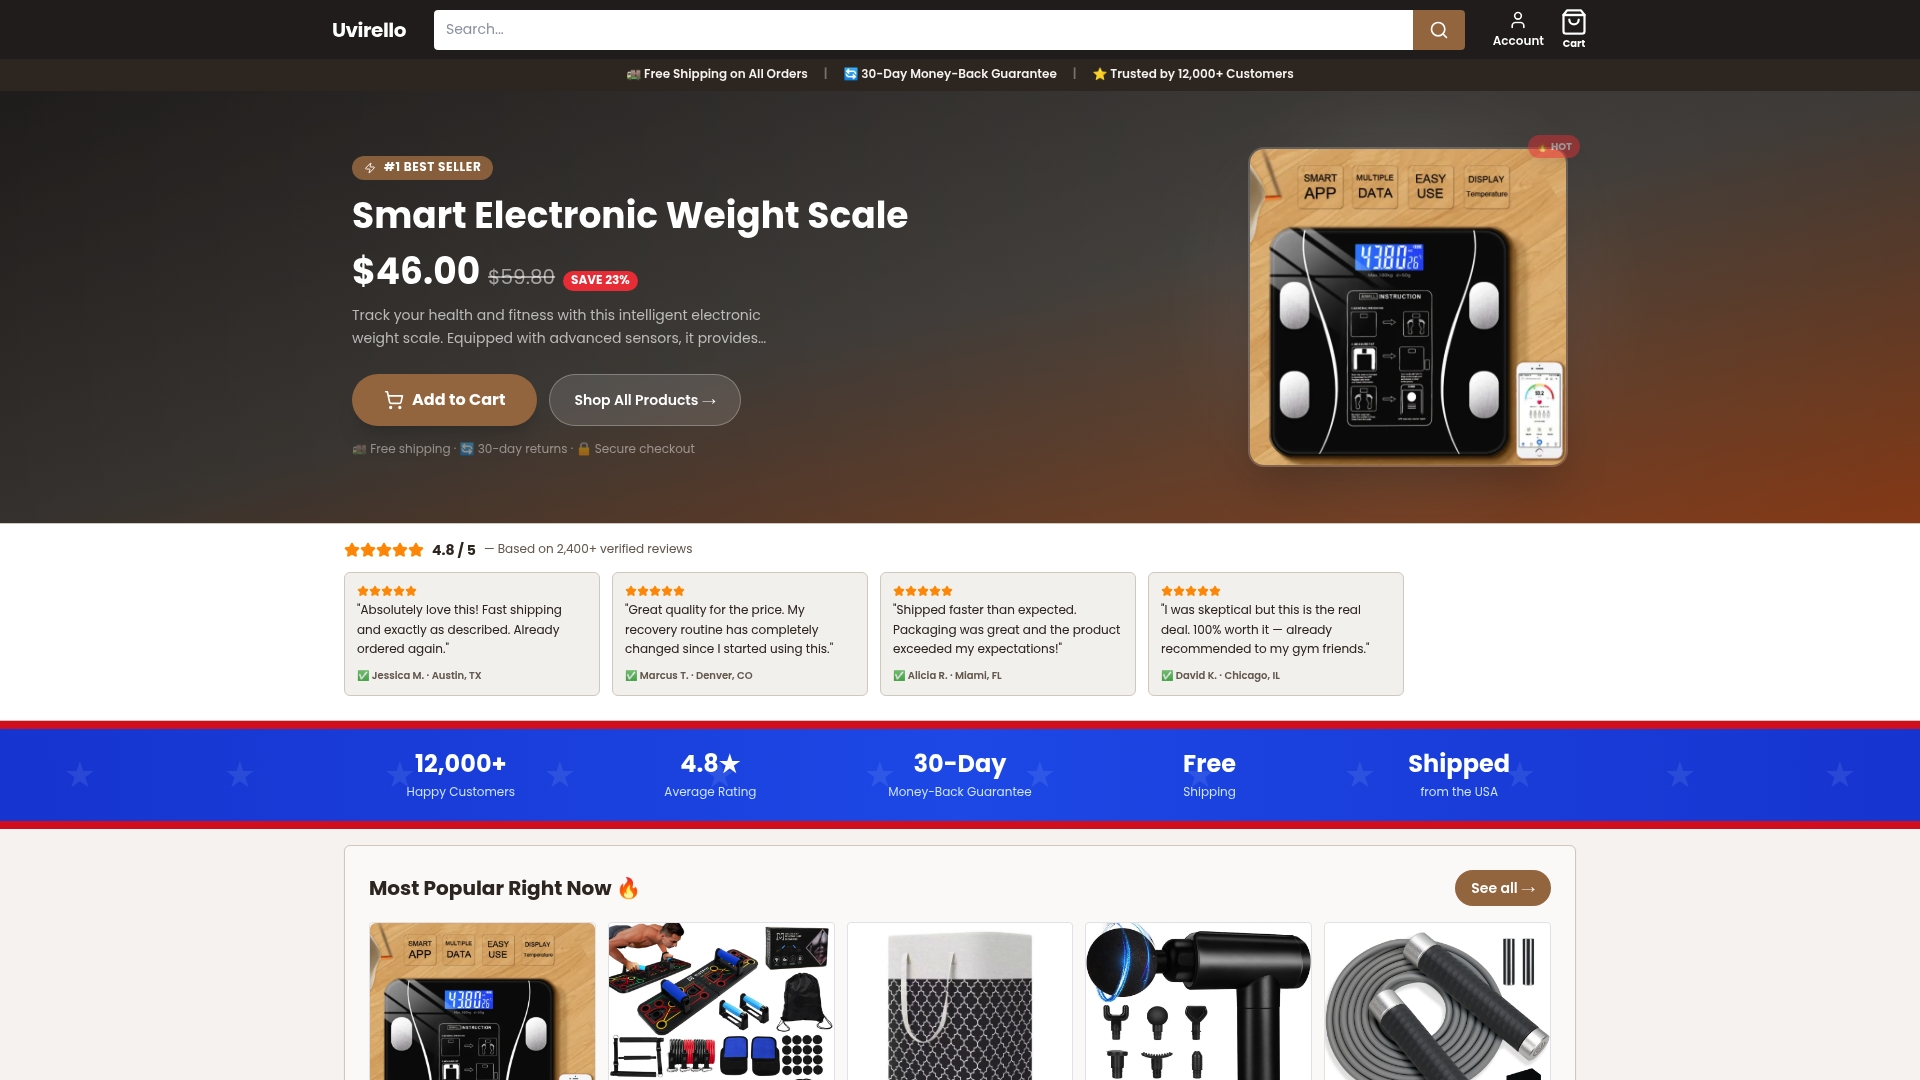
The Uvirello Smart Scale measures body fat percentage, BMI, and additional composition metrics with high-precision sensors, giving you the data points this article covers, delivered in seconds from your bathroom floor. Over 12,000 customers rate it 4.8 out of 5. Pair it with a lunchbreak workout tracking routine to connect your composition trends directly to your training effort. The scale is the starting point. The data is what drives the results.
FAQ
What is body composition and why does it matter?
Body composition is the breakdown of your body into fat mass, lean mass, bone, and water. It matters because two people at the same weight can have completely different health profiles depending on how much of that weight is fat versus muscle.
Is body composition more important than weight for health?
Body composition is a stronger predictor of metabolic health than weight or BMI. Fat distribution, particularly visceral fat, predicts diabetes and cardiovascular disease risk more accurately than total body weight.
How often should i measure body fat percentage?
Weekly BIA scale readings taken under consistent conditions produce reliable trend data for most people. DEXA scans are best used quarterly to benchmark long-term progress.
Can my weight stay the same while my body composition improves?
Yes. Body recomposition can keep total weight unchanged over 12 weeks while fat decreases and muscle increases. This is why scale weight alone is an unreliable measure of fitness progress.
What is the most accurate way to measure body composition at home?
BIA scales offer the best combination of accuracy and convenience for home use. Measuring fasted, after using the bathroom, at the same time each day produces the most reliable trend data despite the device's inherent margin of error.