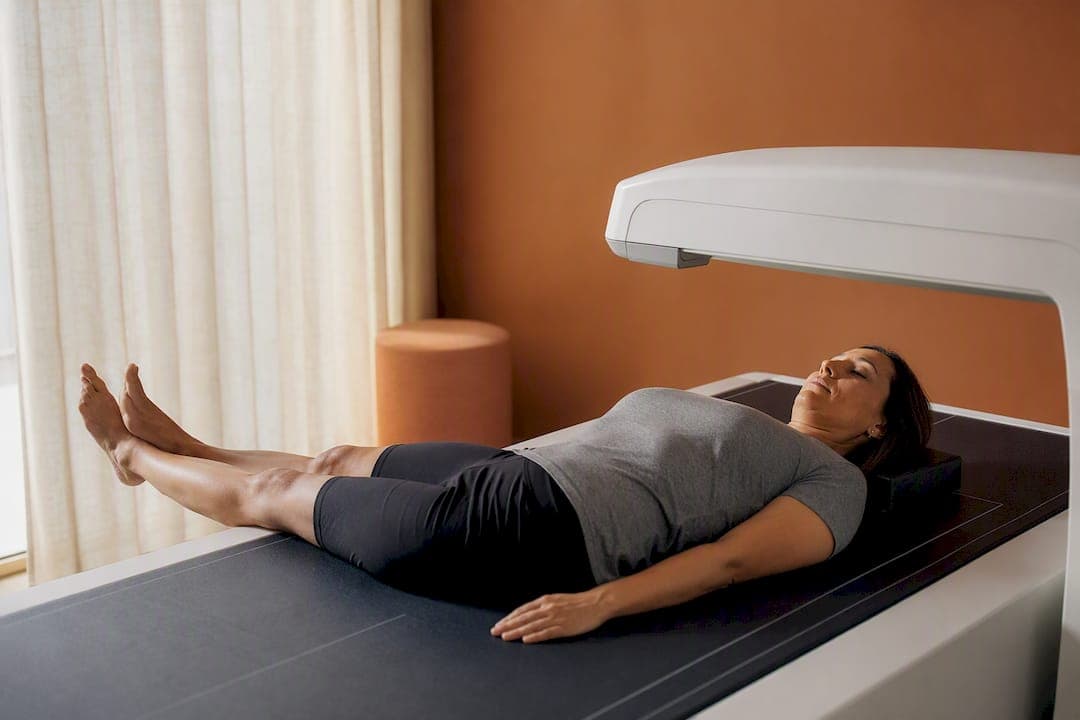
Median body fat rises steadily with age for both sexes, and women's medians run consistently higher than men's at every life stage. These figures come from national health survey percentiles, not clinical thresholds, so treat them as a map of where you stand among your peers rather than a target to hit.
TL;DR:
- Body fat percentage generally increases with age, from the mid-20s in men and mid-30s in women, then plateaus or slightly declines after 60.
- DXA scans provide the most accurate measurements, but at-home scales with BIA technology can track trends if used consistently and with proper protocol.
- Body fat categories range from essential (2-5% men, 10-13% women) to obese (30%+ men, 42%+ women), with practical health risks linked to visceral fat distribution.
- Population-based charts serve as benchmarks for Americans and are less precise for individuals with different ethnic fat distribution patterns; companion measurements improve risk assessment.
- Tracking over weeks—rather than daily fluctuations—is key to understanding true changes, and setting realistic, demographic-based body fat goals helps prevent unhealthy pursuit of lower percentages.
Table of Contents
- Body Fat Percentage Chart by Age and Sex
- Body Fat Categories: Essential, Athletic, Fitness, Average, and Obese
- How Is Body Fat Measured, and Which Method Should You Trust?
- How Do You Interpret Your Body Fat Percentage?
- Uvirello's Home-Tracking Protocol: What Actually Produces Reliable Numbers
- Do Body Fat Norms Differ by Ethnicity or Race?
- What Does Your Body Fat Percentage Actually Mean for Your Health?
- How Often Should You Measure Your Body Fat Percentage?
- How Should You Set a Body Fat Goal?
- Common Misconceptions About Body Fat Charts
- Why These Charts Get Misused, and What to Do Instead
- Sources
Body Fat Percentage Chart by Age and Sex
The numbers below come from DXA scans, the imaging method researchers treat as the reference standard for measuring body composition because it separates fat, muscle, and bone with far less error than a bathroom scale or a set of calipers. The CDC's NHANES survey has tracked these percentiles across tens of thousands of Americans, and the pattern is remarkably consistent: body fat climbs through the 20s and 30s, plateaus in midlife, and often dips slightly in the oldest age groups as muscle and fat both decline.
| Age Group | Men: Median % | Men: 25th–75th Percentile | Women: Median % | Women: 25th–75th Percentile |
|---|---|---|---|---|
| 20–24 | 25% | 17–28% | 35% | 28–40% |
| 30–38 | 25% | 19–30% | 36% | 30–42% |
| 40–48 | 26% | 21–32% | 38% | 32–44% |
| 50–58 | 28% | 23–33% | 40% | 34–46% |
| 60–68 | 30% | 24–35% | 42% | 35–47% |
| 70–78 | 31% | 25–36% | 42% | 36–48% |
| 80 | 30% | 24–35% | 44% | 36–48% |
These bands are drawn from DXA-based population tables and cross-checked against an interactive age comparison calculator built on the same NHANES foundation, plus a separate set of percentile norms by age and sex that break the same data into finer bands.
A few notes on reading this table:
- Median means half the people in that age and sex group fall above the number, half below. It's the "typical" value, not an average pulled up by outliers.
- 25th–75th percentile is the range where the middle half of the population lands. If you're inside it, you're solidly average for your demographic. Outside it in either direction just means you're less typical, not necessarily unhealthy.
- These numbers reflect Americans specifically. DXA-based percentiles show U.S. adults running higher on average than populations in many other countries, which is one reason a chart built for the general public should be read as a domestic benchmark, not a universal ideal.
Body Fat Categories: Essential, Athletic, Fitness, Average, and Obese
Fitness sources typically break body fat into five bands, though the exact cutoffs shift depending on which organization publishes them. Here's the version most trainers and public health sources converge on:
- Essential fat: roughly 2–5% for men, 10–13% for women. This is the fat your body needs for hormone production and organ protection. Below it, health function starts to break down.
- Athletes: roughly 6–13% for men, 14–20% for women. Common among competitive bodybuilders and endurance athletes in-season.
- Fitness: roughly 14–17% for men, 21–24% for women. Visible muscle definition, active lifestyle.
- Average/acceptable: roughly 18–24% for men, 25–31% for women. Where most healthy, moderately active adults land.
- Obese range: Harvard Health defines obesity as ≥30% for men and ≥42% for women, with "overweight" starting at ≥25% for men and ≥36% for women.
Notice the wide gap between male and female essential fat. Also worth flagging: these category labels vary by source, and none of them substitute for a clinical diagnosis. They're useful shorthand, not medical thresholds.
How Is Body Fat Measured, and Which Method Should You Trust?
DXA (dual-energy X-ray absorptiometry) is the gold standard. It scans your entire body and separates fat, lean mass, and bone mineral content with high precision. The catch: it requires a clinical or research facility, costs money per scan, and isn't something you do weekly.
BIA (bioelectrical impedance), the tech inside consumer smart scales, sends a low-level electrical current through your body and estimates fat based on resistance. It's convenient and free after purchase, but readings shift with hydration, recent exercise, and how much you've eaten. A single reading can bounce a few percentage points in either direction.
Skinfold calipers pinch fat at several body sites and plug the measurements into a formula. Accuracy depends heavily on the technician's skill and consistency, which makes it a poor choice for self-measurement at home.
Hydrostatic (underwater) weighing is nearly as accurate as DXA but requires submersion tanks that most gyms and clinics don't have, making it the least accessible option.
For anyone tracking progress at home, BIA scales are the practical choice, but only if you control for the biggest sources of error: hydration level, time since your last workout, and whether you've eaten recently. Here's a protocol that removes most of that noise:
- Weigh yourself first thing in the morning, after using the bathroom, before eating or drinking anything.
- Wear the same amount of clothing (or none) every time.
- Avoid measuring within 12 hours of an intense workout or sauna session.
- Use the same scale every time. Switching devices introduces model-to-model variation that has nothing to do with your actual body.
- Take readings 3 to 4 times a week and compare weekly averages, not single days.
Pro Tip: A single body fat reading tells you almost nothing. The trend line across four to six weeks is what actually reflects fat loss or gain. If your number jumps around, that's device noise, not proof your program failed.
How Do You Interpret Your Body Fat Percentage?
A percentage on its own is a benchmark, not a diagnosis. Where you fall on the chart above compares you to a national population, but your personal target should account for your training history, age, and goals.
This is where companion measures earn their keep. Harvard Health points out that waist circumference and waist-to-height ratio often predict metabolic risk more reliably than body fat percentage alone, because they capture where fat is stored, not just how much exists. Visceral fat around the abdomen carries more metabolic risk than fat stored elsewhere, and body fat percentage doesn't distinguish between the two.
Practical thresholds worth tracking alongside your body fat number:
- Waist circumference: above 40 inches for men or 35 inches for women is associated with elevated obesity-related health risk.
- Waist-to-height ratio: keeping this below 0.5 (waist measurement divided by height) is a widely used marker of healthier fat distribution.
A few signs point toward getting a professional evaluation rather than adjusting your training plan on your own: a rapid, unexplained change in body fat over a few weeks, a body fat percentage that drops well below the essential fat range without an athletic training background to explain it, or signs of muscle loss (weakness, reduced grip strength) alongside a body fat reading that looks "average." That last combination is worth taking seriously, and we'll come back to why.
Our guide on why tracking body composition beats tracking weight alone goes deeper into why the number on a scale can mislead you even when body fat is heading in the right direction.
Uvirello's Home-Tracking Protocol: What Actually Produces Reliable Numbers
Consistency beats precision here. A protocol used the same way every time will tell you more about your progress than a technically accurate reading taken under random conditions.
- Measure at the same time every morning, after voiding, before food or coffee.
- Wear minimal, consistent clothing.
- Log the day's context (workout the night before, poor sleep, alcohol) so odd readings make sense later instead of triggering panic.
- Compare 7-day rolling averages, not day-to-day swings.
A scale's value comes down to sensor consistency and whether it stores your history in a way you'll actually revisit. Uvirello's Smart Electronic Weight Scale uses high-precision sensors built for this kind of repeat measurement, and its companion app keeps a running history so trend lines, not single data points, drive your decisions. That's the same principle behind how tracking trends beats single readings: one number is a snapshot, a month of numbers is a story.
Pro Tip: Set your reminder for the same 15-minute window every morning. Scales that sync automatically to an app remove the friction that makes most people quit tracking within two weeks.
Do Body Fat Norms Differ by Ethnicity or Race?
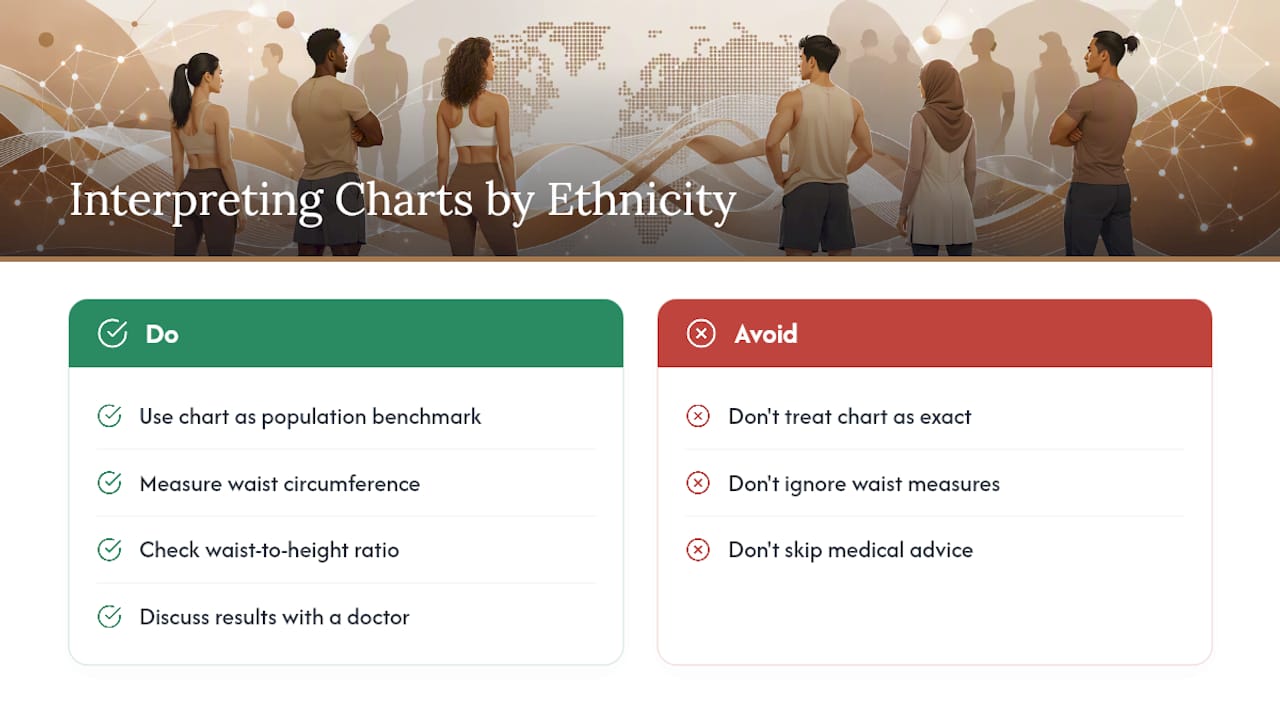
Population research on body composition has found that body fat distribution and its relationship to health risk isn't identical across ethnic groups, even at similar body fat percentages or BMI values. Some ethnic populations tend to carry more visceral fat at a given body fat percentage than others, which changes how the same number on a chart should be interpreted.
The practical implication: a body fat percentage chart built from a general U.S. population sample, like the one earlier in this article, gives you a reasonable benchmark against the broader population, but it isn't a precision instrument for every individual case. If you come from an ethnic background known to carry higher visceral fat at a given body fat level, waist circumference and waist-to-height ratio deserve more weight in your personal risk picture than the body fat percentage alone.
This doesn't mean the charts are useless for anyone outside the "average" demographic they were built on. It means the chart tells you where you sit relative to a broad population, and companion measures tell you more about your individual metabolic risk. Neither replaces a conversation with a doctor who knows your personal and family health history, particularly if you're managing conditions like diabetes or cardiovascular disease where fat distribution matters as much as total fat mass.
What Does Your Body Fat Percentage Actually Mean for Your Health?
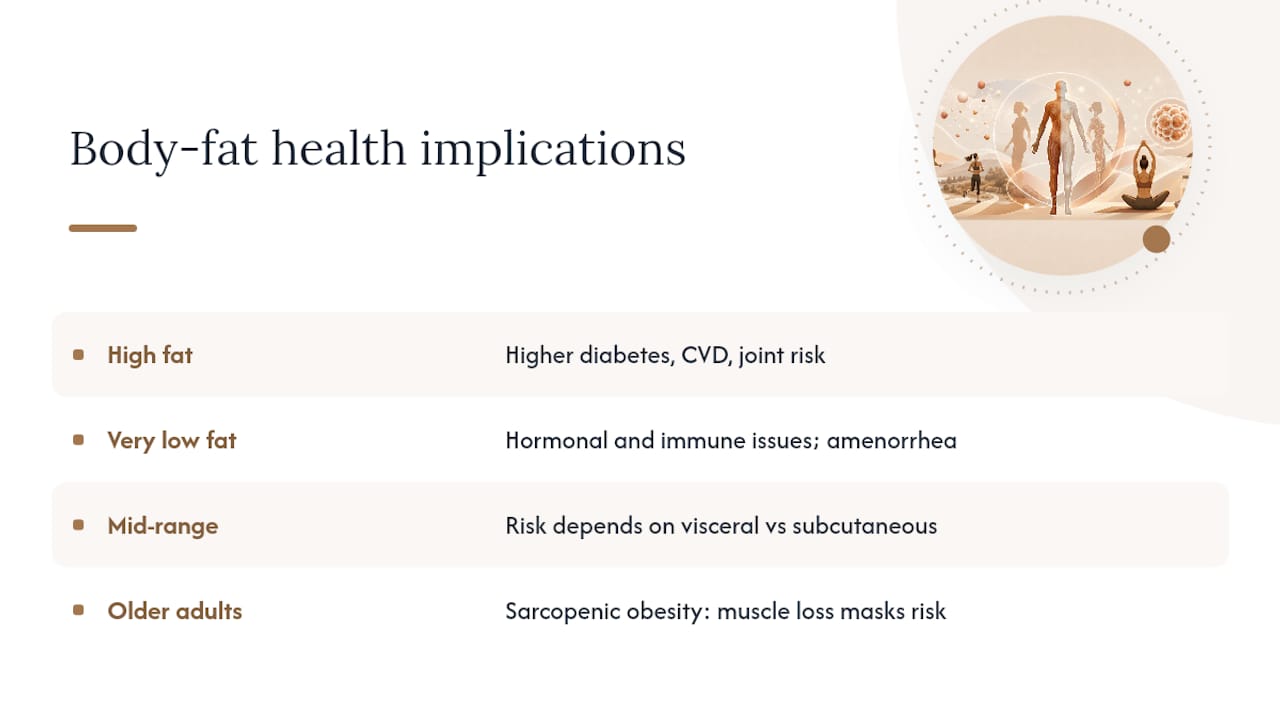
Body fat percentage correlates with several measurable health outcomes, but the relationship isn't a straight line where lower is always better. At the high end, obesity-range body fat is linked to elevated risk for type 2 diabetes, cardiovascular disease, and joint problems. At the very low end, especially below essential fat thresholds, the risks flip toward hormonal disruption, weakened immune function, and in women, loss of menstrual cycles.
The middle of the range is where most of the nuance lives. Two people with identical body fat percentages can carry very different health risk if one stores fat viscerally (around organs) and the other stores it subcutaneously (under the skin). This is why a chart placement in the "average" category doesn't automatically mean low risk, and a placement in "fitness" or "athletic" doesn't guarantee good metabolic health either.
Age adds another layer. Sarcopenic obesity, where someone loses muscle mass while body fat percentage stays flat or even looks unremarkable, is a real risk for older adults. Harvard Health flags this as a case where the body fat number can mask declining functional health, because the scale shows nothing alarming while strength and mobility quietly decline. That's a strong argument for pairing body fat tracking with a basic strength check, like grip strength or how easily you can rise from a chair without using your hands.
How Often Should You Measure Your Body Fat Percentage?
Weekly measurement, averaged, is the sweet spot for most people actively working toward a body composition goal. Daily readings are fine if you're using them correctly, meaning you're averaging them rather than reacting to each individual number, since day-to-day swings from water retention and food volume can be larger than your actual weekly fat change.
If you're in a maintenance phase and not actively trying to shift your body composition, monthly check-ins are usually enough to catch drift before it becomes a pattern. Ramping up to twice-weekly measurement makes sense during periods of active dieting or intense training blocks, where you want an earlier signal if something's off track.
One schedule mistake worth avoiding: measuring right after starting a new program and then again a week later expecting to see a meaningful shift. Body composition changes on a timescale of weeks, not days. A more useful cadence is measuring consistently for four weeks, then reviewing the trend line as a whole rather than comparing week one to week two. That single change in how people read their own data prevents most of the discouragement that causes people to quit tracking altogether.
How Should You Set a Body Fat Goal?
Pick a target range, not a single number.
Anchor your range to the category above, not below, your current one. If you're in the "average" range now, targeting the top of "fitness" is a realistic multi-month goal. Jumping straight to "athletic" from "average" usually means an aggressive deficit that costs muscle along with fat, which defeats the purpose.
Age and sex should shape the target too. Set the goal against your own demographic's typical range, then decide how far below it you want to push based on your training capacity and how sustainable that effort actually is.
Our piece on reading body composition metrics as a full picture covers how to weigh muscle mass gains against fat percentage drops when both are moving during a training block.
Common Misconceptions About Body Fat Charts
The biggest one: treating a chart percentile as a clinical verdict. These charts describe where you sit compared to other Americans your age and sex. They don't diagnose metabolic disease, and being in the "average" band doesn't mean your health is average in every sense.
Another common error is assuming one BIA reading is precise to the decimal point. It's an estimate with a margin of error that shifts with hydration and timing, which is why the trend across weeks matters more than any single figure.
People also assume lower is always better. Below the essential fat range, health risk climbs again, not falls. And plenty of people conflate BMI charts with body fat charts, treating them as interchangeable when BMI can't distinguish muscle from fat at all, which is exactly why a muscular person often lands in BMI's "overweight" category despite low body fat.
Last, there's a belief that body fat percentage should be identical for men and women at the same fitness level. It shouldn't. The essential fat difference between the sexes is a structural fact, not a fitness gap.
Why These Charts Get Misused, and What to Do Instead
The conventional advice tells people to find their number on a chart and treat it as a verdict. That's backwards. A percentile chart built from national survey data is a mirror held up to a population, not a judgment on any one person's health, and I think most of the anxiety around body fat percentage comes from treating it like a test score instead of a coordinate.
What the research actually supports is something less dramatic and more useful: pick a measurement method, control the conditions, and watch the trend for a month before drawing any conclusion. Waist-to-height ratio and strength metrics deserve at least as much attention as the body fat number itself, especially past age 50, where muscle loss can hide behind a body fat reading that looks perfectly ordinary.
If you take one thing from this article, make it this: consistency in how you measure matters more than which method you choose. A mediocre method used the same way every week beats a perfect method used once.
— Jacob
This article is general information, not a substitute for advice from a qualified doctor. Consult a qualified healthcare professional about your own circumstances before acting on anything here.
Sources
- What is considered a healthy body fat percentage as you age? - Harvard Health
- QuickStats: Mean Percentage Body Fat,* by Age Group and Sex — NHANES (CDC)
- Body Fat Percentage Norms by Age & Sex | FitnessNorms
- Body Fat Percentage by Age Comparison Calculator for the United States - DQYDJ