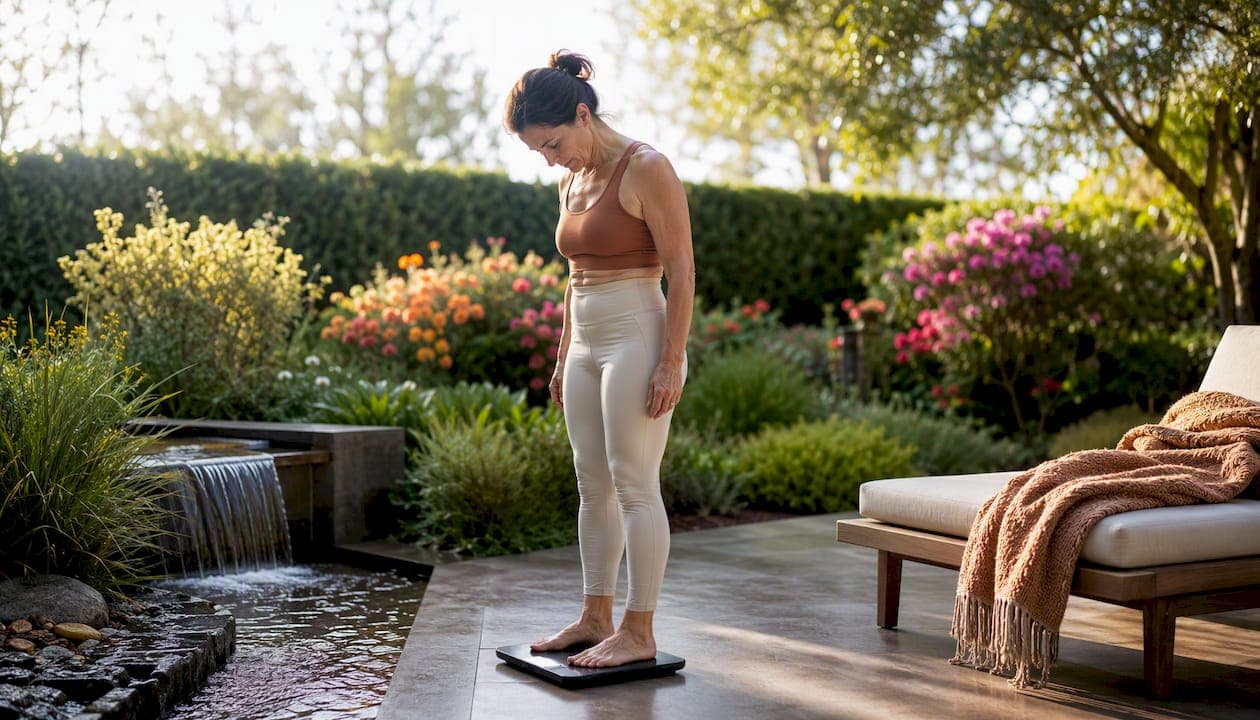
Body composition metrics measure how much of your weight is fat, muscle, bone, and water — and those proportions tell you far more about your health and fitness than the number on the scale ever could. Body composition describes the relative amounts of fat mass versus fat-free mass (muscle, bone, organs, and fluids), giving you a picture of what your body is actually made of rather than just how heavy it is.
Here is the core takeaway before anything else: track trends, not single readings. A one-time body fat percentage means almost nothing in isolation. What matters is the direction your numbers move over weeks and months, and whether the metrics that most predict health risk — visceral fat and skeletal muscle mass — are moving the right way.
What you need to know at a glance:
-
Body composition is more informative than BMI or body weight alone, particularly for muscular individuals and older adults
-
The key metrics to monitor are body fat percentage, skeletal muscle mass, visceral fat, and total body water
-
DEXA (dual-energy X-ray absorptiometry) is the clinical reference standard; consumer BIA scales are practical for trend tracking
-
Multi-week trends beat daily readings every time — body fat percentage naturally fluctuates with hydration, time of day, and recent exercise
-
Visceral fat carries more metabolic risk than total body fat percentage and deserves its own attention
-
Combine body composition data with clinical markers (blood pressure, fasting glucose) for a complete health picture
Table of Contents
- What are the two main models of body composition?
- Key body composition metrics explained: what each number means
- How do the main measurement methods compare?
- How do you interpret a body composition report?
- Why does visceral fat matter more than total body fat?
- How do you measure body composition reliably at home?
- What consumer smart scales can and cannot tell you
- Uvirello's smart scale makes at-home trend tracking straightforward
- Key Takeaways
- The numbers are only as useful as the habits behind them
- Sources and further reading
What are the two main models of body composition?
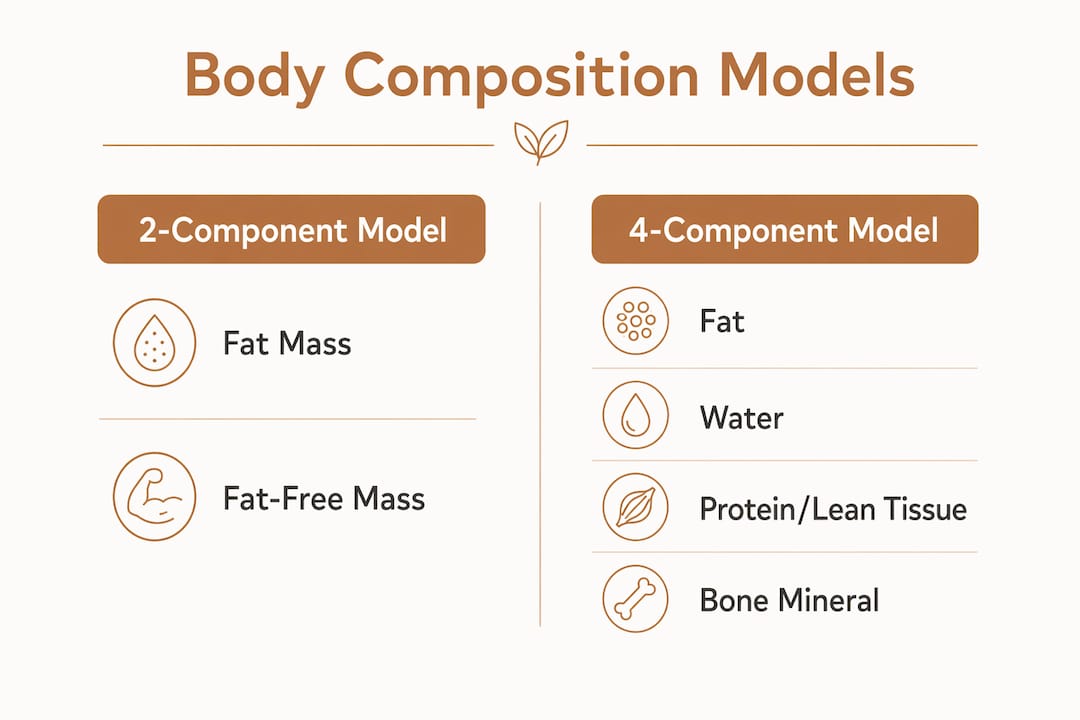
Most body composition tests are built on one of two frameworks, and knowing which one your test uses changes how you interpret the results.
The 2-component model
The simplest approach splits body weight into two buckets: fat mass and fat-free mass (everything that is not fat — muscle, bone, organs, and water). Most consumer smart scales and basic BIA devices use this model. It is practical and easy to communicate, but it lumps together very different tissues under "fat-free mass," which can introduce error when hydration or bone density is unusual.

The 4-component model
The 4-component (4C) model separates body weight into fat, water, protein/lean tissue, and bone mineral. It is considered the most accurate framework in research and clinical settings because it accounts for individual variation in bone density and hydration — two factors that cause the 2C model to over- or underestimate fat mass. DEXA combined with additional water-dilution measures can approximate a 4C assessment. For most people outside a research lab, this level of detail is not accessible, but understanding it explains why different tests sometimes give different fat percentage readings for the same person.
Why BMI is not a body composition metric
BMI calculates a ratio of weight to height squared. It does not measure fat, muscle, or bone at all. A 200-pound powerlifter and a 200-pound sedentary adult can share the same BMI while having completely different body compositions and health profiles. BMI also cannot locate fat — belly fat carries far greater metabolic risk than fat stored in the thighs and hips, and BMI is blind to that distinction. Think of BMI as a rough population-level screening tool, not a personal health diagnostic.
Pro Tip: If your BMI flags you as "overweight" but you train regularly, ask for a body composition test before drawing any health conclusions. Muscle density makes the BMI formula unreliable for athletes and anyone with above-average lean mass.
Key body composition metrics explained: what each number means
Smart scales and clinical reports can surface anywhere from four to twelve numbers. Here is what each one actually represents.
Body fat percentage
Body fat percentage is the fraction of your total weight that is fat tissue, expressed as a percent. It is the most commonly reported metric and the one most people fixate on. Healthy ranges vary meaningfully by sex and age: generally, adult women have higher body fat percentages considered healthy than adult men. These ranges are approximate and shift with age. Athletes often fall below these ranges. These are approximate reference bands, not clinical cutoffs, and they shift with age — older adults naturally carry more fat even at the same fitness level.
Fat mass vs. fat-free mass
Fat mass is the absolute weight of your fat tissue (in pounds or kilograms). Fat-free mass covers everything else: skeletal muscle, bone, organs, connective tissue, and body fluids. Tracking both matters because you can lose fat mass and gain muscle simultaneously while your total weight barely moves — a scenario where the scale is completely uninformative but body composition metrics tell the real story.
Skeletal muscle mass
Skeletal muscle mass is the weight of the muscles you voluntarily control. It is the metric most directly tied to metabolic rate, functional strength, and long-term independence. Resistance training is consistently the most effective way to increase skeletal muscle mass, and doing so raises your resting metabolic rate, making fat loss easier to sustain over time. Losing skeletal muscle mass — which happens with crash dieting, prolonged inactivity, or aging — is one of the clearest warning signs in a body composition report.
Bone mineral content and density
Bone mineral content (BMC) is the total mass of mineral in your bones; bone mineral density (BMD) expresses that mineral relative to bone area. These metrics matter most for osteoporosis screening and long-term fracture risk. Consumer BIA scales estimate BMC using population-based equations rather than direct measurement, so treat those numbers as rough indicators. DEXA gives a clinically reliable BMD reading.

Total body water and fluid compartments
Total body water (TBW) is the sum of all fluid in your body, typically 45–65% of body weight depending on sex, age, and lean mass. It splits into intracellular water (inside cells, where metabolic work happens) and extracellular water (outside cells, including blood plasma and lymph). A sudden spike in extracellular water can signal inflammation or poor recovery. Tracking TBW trends is useful for athletes managing hydration and for anyone monitoring edema or recovery status.
Visceral fat
Visceral fat surrounds the internal organs in the abdominal cavity. Most consumer scales report a visceral fat score or level (typically on a scale of 1–59 or similar, depending on the device). Elevated visceral fat correlates with higher risk of metabolic syndrome, insulin resistance, and cardiovascular disease — more strongly than total body fat percentage does. This is the metric worth watching most closely for metabolic health, regardless of what the overall fat percentage says.
Basal metabolic rate (BMR) and resting metabolic rate (RMR)
BMR and RMR represent the calories your body burns at rest to maintain basic functions. Many smart scales estimate these from lean mass, age, sex, and height using population equations. The numbers are useful as relative benchmarks — if your estimated BMR rises over a 12-week strength program, that is a sign you have added metabolically active muscle. Do not treat the absolute calorie figure as precise; use it directionally.
Pro Tip: A single body fat percentage reading is a point estimate, not a verdict. Fluctuations of 1–2 percentage points between morning and evening are normal and reflect hydration shifts, not actual fat change. Prioritize the direction of your 4-week rolling average.
Key stat: Body fat percentage naturally fluctuates with time of day, menstrual cycle phase, hydration, and recent exercise — which is why experts recommend focusing on multi-week trends rather than any single reading.
How do the main measurement methods compare?
Choosing the right measurement method depends on your goals, budget, and how much precision you actually need. Here is a clear breakdown.
DEXA (dual-energy X-ray absorptiometry)
DEXA passes two low-level X-ray beams through body tissue at different rates to estimate fat mass, lean mass, and bone mineral density by region (arms, legs, trunk). It is the most widely used clinical reference standard for body composition research. A full-body scan takes about 10–20 minutes. The main limitations: it cannot distinguish visceral from subcutaneous fat, it requires specialized equipment, and it is not suitable for pregnant women or children. Cost in the US typically runs $75–$200 per scan at sports medicine clinics or university labs.
Hydrostatic weighing and air-displacement plethysmography (BodPod)
Both methods estimate body density and derive fat percentage from it. Hydrostatic weighing submerges you in a water tank and compares underwater weight to land weight — fat floats, muscle sinks, so the ratio reveals density. The BodPod uses air displacement instead of water, making it more comfortable and faster. Both are accurate and well-validated, but access is limited to university labs and specialized clinics.
MRI and CT imaging
MRI and CT are considered the gold standard for measuring specific fat compartments, including visceral and subcutaneous fat separately. They can image individual organs and regional muscle groups with precision no other method matches. The trade-off is cost (hundreds to thousands of dollars per scan), radiation exposure with CT, and availability only in clinical or research settings. For most people, these are reserved for medical investigations, not fitness tracking.
Skinfold calipers and circumference measurements
A trained technician uses calipers to pinch and measure subcutaneous fat at specific body sites, then applies a prediction equation to estimate total body fat. Accuracy depends heavily on the technician's skill and consistency. Done well by the same person each time, skinfolds are a reliable and inexpensive tracking tool. Waist circumference is similarly low-tech but correlates well with abdominal fat changes and is a practical proxy for visceral fat trends.
Bioelectrical impedance analysis (BIA)
BIA sends a small electrical current through the body. The current travels faster through water and lean tissue than through fat, so resistance measurements are used to estimate body composition. Consumer scales use single-frequency BIA; clinical devices often use multi-frequency or segmental BIA, which measures impedance through individual limbs and the trunk separately for better accuracy. The biggest limitation of all BIA devices: results are highly sensitive to hydration status, food intake, and recent exercise. Handheld or single-frequency BIA devices can under- or over-estimate body fat depending on testing conditions, sometimes by a meaningful margin compared to DEXA.
| Method | What it measures | Typical error vs. DEXA | Cost / availability | Best for |
|---|---|---|---|---|
| DEXA | Fat, lean, bone mineral (regional) | Reference standard | $75–$200 / sports clinics | Clinical precision, bone health |
| Hydrostatic weighing | Body density → fat % | Low (well-validated) | Low cost / limited access | Research, accurate fat % |
| BodPod | Body density → fat % | Low to moderate | Moderate / university labs | Comfortable alternative to hydrostatic |
| MRI / CT | Regional fat compartments, organs | Lowest (gold standard) | High / clinical only | Visceral fat imaging, medical use |
| Skinfold calipers | Subcutaneous fat sites | Moderate (operator-dependent) | Very low / widely available | Consistent tracking with same technician |
| Consumer BIA scale | Fat %, lean mass, TBW (estimated) | Moderate to high | Very low / home use | Trend tracking under consistent conditions |
| Segmental / multi-frequency BIA | Regional fat and lean (limbs + trunk) | Moderate | Low to moderate / clinics | Better BIA accuracy than single-frequency |
Accuracy note: Consumer BIA devices are practical for tracking trends but carry meaningful error margins compared to DEXA, particularly when testing conditions vary. Standardize your conditions every time to get the most out of them.
How do you interpret a body composition report?
Getting a number is the easy part. Knowing what to do with it is where most people get stuck.
Reference ranges and their limits
Reference ranges for body fat percentage vary by sex, age, and the method used to measure them. The table below gives commonly cited approximate ranges; treat them as orientation, not clinical cutoffs.
| Category | Women (approx.) | Men (approx.) | Notes |
|---|---|---|---|
| Essential fat | 10–12% | 2–5% | Minimum for physiological function |
| Athletic | 15–20% | 6–12% | Competitive athletes |
| Fitness | 21–23% | 14–16% | Active, health-conscious adults |
| Acceptable | 25–30% | 18–23% | Average healthy adult |
| Obese | 32% | 25%+ | Elevated health risk |
| Total body water (TBW) | 45–65% of body weight | 45–65% of body weight | Varies with lean mass and age |
Ranges are approximate and vary by source and measurement method. Do not compare results across different methods.
Judging meaningful change
Measurement error is real. A consumer BIA scale may have a margin of several percentage points, so a 0.5% change in body fat from one week to the next is noise, not signal. A meaningful change clears the method's typical error margin over multiple readings. As a practical rule: look for consistent directional movement over four or more weeks before concluding that your body composition has actually shifted.
Here is a numbered approach to interpreting change over time:
- Establish a baseline. Take three readings under identical conditions on consecutive days and average them. That average is your starting point.
- Measure consistently. Same device, same time of day, same preparation every time.
- Calculate a 4-week rolling average. Compare rolling averages, not individual readings.
- Apply the error margin. If your device's typical error is ±2–3%, a change smaller than that over a short period is not conclusive.
- Look at multiple metrics together. Fat mass trending down while lean mass holds or rises is a better signal than body fat percentage alone.
Red flags worth acting on
- Body fat percentage below essential fat thresholds (under 10% for women, under 2–5% for men) warrants clinical evaluation
- A rapid, unexplained drop in total body water or a sudden spike in extracellular water
- A measurable decline in bone mineral content over successive DEXA scans
- Visceral fat scores that are consistently elevated or rising despite lifestyle changes
- Any body composition concern accompanied by fatigue, hormonal symptoms, or unexplained weight change
Pro Tip: Body composition data does not replace clinical markers. Pair your metrics with blood pressure, fasting glucose, and a lipid panel at your annual physical. Combining these measures gives a far more complete picture of metabolic risk than any single number.
Why does visceral fat matter more than total body fat?
Visceral fat is not just excess storage. It is metabolically active tissue that releases inflammatory compounds and hormones directly into the portal circulation, which feeds the liver. That proximity to the liver is part of why visceral fat is more strongly linked to metabolic syndrome, insulin resistance, and cardiovascular disease than subcutaneous fat (the fat you can pinch under the skin).
Two people can have the same total body fat percentage and very different metabolic risk profiles, depending on where that fat is stored. An "apple-shaped" fat distribution — more fat around the waist and abdomen — carries higher risk than a "pear-shaped" distribution centered on the hips and thighs. This is why waist circumference and visceral fat estimates deserve their own tracking column, separate from overall fat percentage.
How tests estimate visceral fat:
- MRI and CT imaging can directly measure visceral fat volume — the most accurate method, used in research and clinical settings
- DEXA provides a trunk fat estimate but cannot fully separate visceral from subcutaneous abdominal fat
- Consumer BIA scales use prediction equations to generate a visceral fat score; treat these as relative trend indicators, not absolute measurements
- Waist circumference is a simple, validated proxy: a waist above 35 inches for women or 40 inches for men is associated with elevated cardiometabolic risk
Practical steps to reduce visceral fat:
- Prioritize resistance training targeting major muscle groups — strength training is consistently associated with measurable lean mass increases and improved metabolic markers
- Reduce refined carbohydrate and added sugar intake
- Improve sleep quality and manage chronic stress (both affect cortisol, which drives visceral fat accumulation)
- Track waist circumference monthly alongside your scale metrics as a low-tech confirmation signal
- If visceral fat scores are persistently elevated, seek clinical testing (waist-to-height ratio, fasting insulin, lipid panel) rather than relying on consumer device estimates alone
Clinical note: Elevated visceral fat correlates with higher risk of metabolic syndrome, insulin resistance, and cardiovascular disease — making it a priority metric for cardiometabolic health assessment, independent of total body fat percentage.
How do you measure body composition reliably at home?
The biggest source of error in home body composition tracking is not the device. It is inconsistent testing conditions. BIA measurements are highly sensitive to hydration status — electrical impedance travels faster through water than fat, so exercising, eating, or drinking before a test can materially shift the reading.
Follow this checklist every time you measure:
- Measure first thing in the morning, after waking
- Void your bladder before stepping on the scale
- Do not eat or drink anything beforehand
- Wear minimal or consistent clothing; bare feet on the scale sensors
- Place your feet in the same position on the scale each time
- Avoid measuring within 12 hours of intense exercise
- Use the same device every time — never compare readings across different scales or methods
- Note any factors that could affect results (illness, travel, alcohol the night before)
How often should you measure?
For general fitness tracking, weekly measurements under consistent conditions work well. Daily readings introduce noise that can be discouraging and misleading — a pound of water retention from a salty meal looks identical to a pound of fat gain on a scale. For people in active body recomposition programs, twice-weekly measurements with a rolling average calculation give better signal. Monthly measurements are sufficient for maintenance phases or when the goal is long-term trend monitoring rather than active adjustment.
Pro Tip: Calculate a 4-week rolling average of your key metrics rather than reacting to any single reading. A trendline smooths out the daily noise and shows you what is actually happening over time. Most smart scale apps do this automatically — if yours does not, a simple spreadsheet works just as well.
What consumer smart scales can and cannot tell you
Consumer BIA scales have real value for trend tracking, and it is worth being clear about exactly where that value starts and stops.
Single-frequency BIA scales send one frequency of electrical current through the body and apply a population-based algorithm to estimate fat percentage, lean mass, and other metrics. The algorithm is calibrated to average body proportions, which means it can be systematically off for people who fall outside that average — very lean athletes, older adults with lower muscle mass, or people with unusual hydration patterns. Segmental BIA devices (which measure limbs and trunk separately) and multi-frequency devices reduce some of this error, but they are still not DEXA.
The practical error margin for a consumer BIA scale compared to DEXA can be several percentage points in either direction, depending on the individual and testing conditions. That sounds discouraging, but it does not mean the device is useless. What it means is that the absolute number is less reliable than the direction of change. If your body fat percentage on the same scale under the same conditions drops from 28% to 25% over 12 weeks, that directional signal is meaningful even if the absolute 28% was not perfectly accurate to begin with.
Where consumer devices fall short is clinical decision-making. If you are trying to determine whether you have sarcopenia, assess fracture risk, or make a medical decision based on body composition, a consumer scale is not the right tool. DEXA, hydrostatic weighing, or a clinician-supervised assessment is appropriate. The same applies if your readings are in a concerning range — very low body fat, very high visceral fat scores, or unexplained rapid changes — and you need a reliable number to act on.
For fitness tracking accuracy in a home setting, the key is not finding the most accurate single reading. It is minimizing variability between readings so that trends are interpretable. That means consistent conditions, the same device, and patience.
Uvirello's smart scale makes at-home trend tracking straightforward
Most people do not need a DEXA scan every month. What they need is a reliable way to watch their numbers move in the right direction over time, without booking a clinic appointment or spending hundreds of dollars per reading.
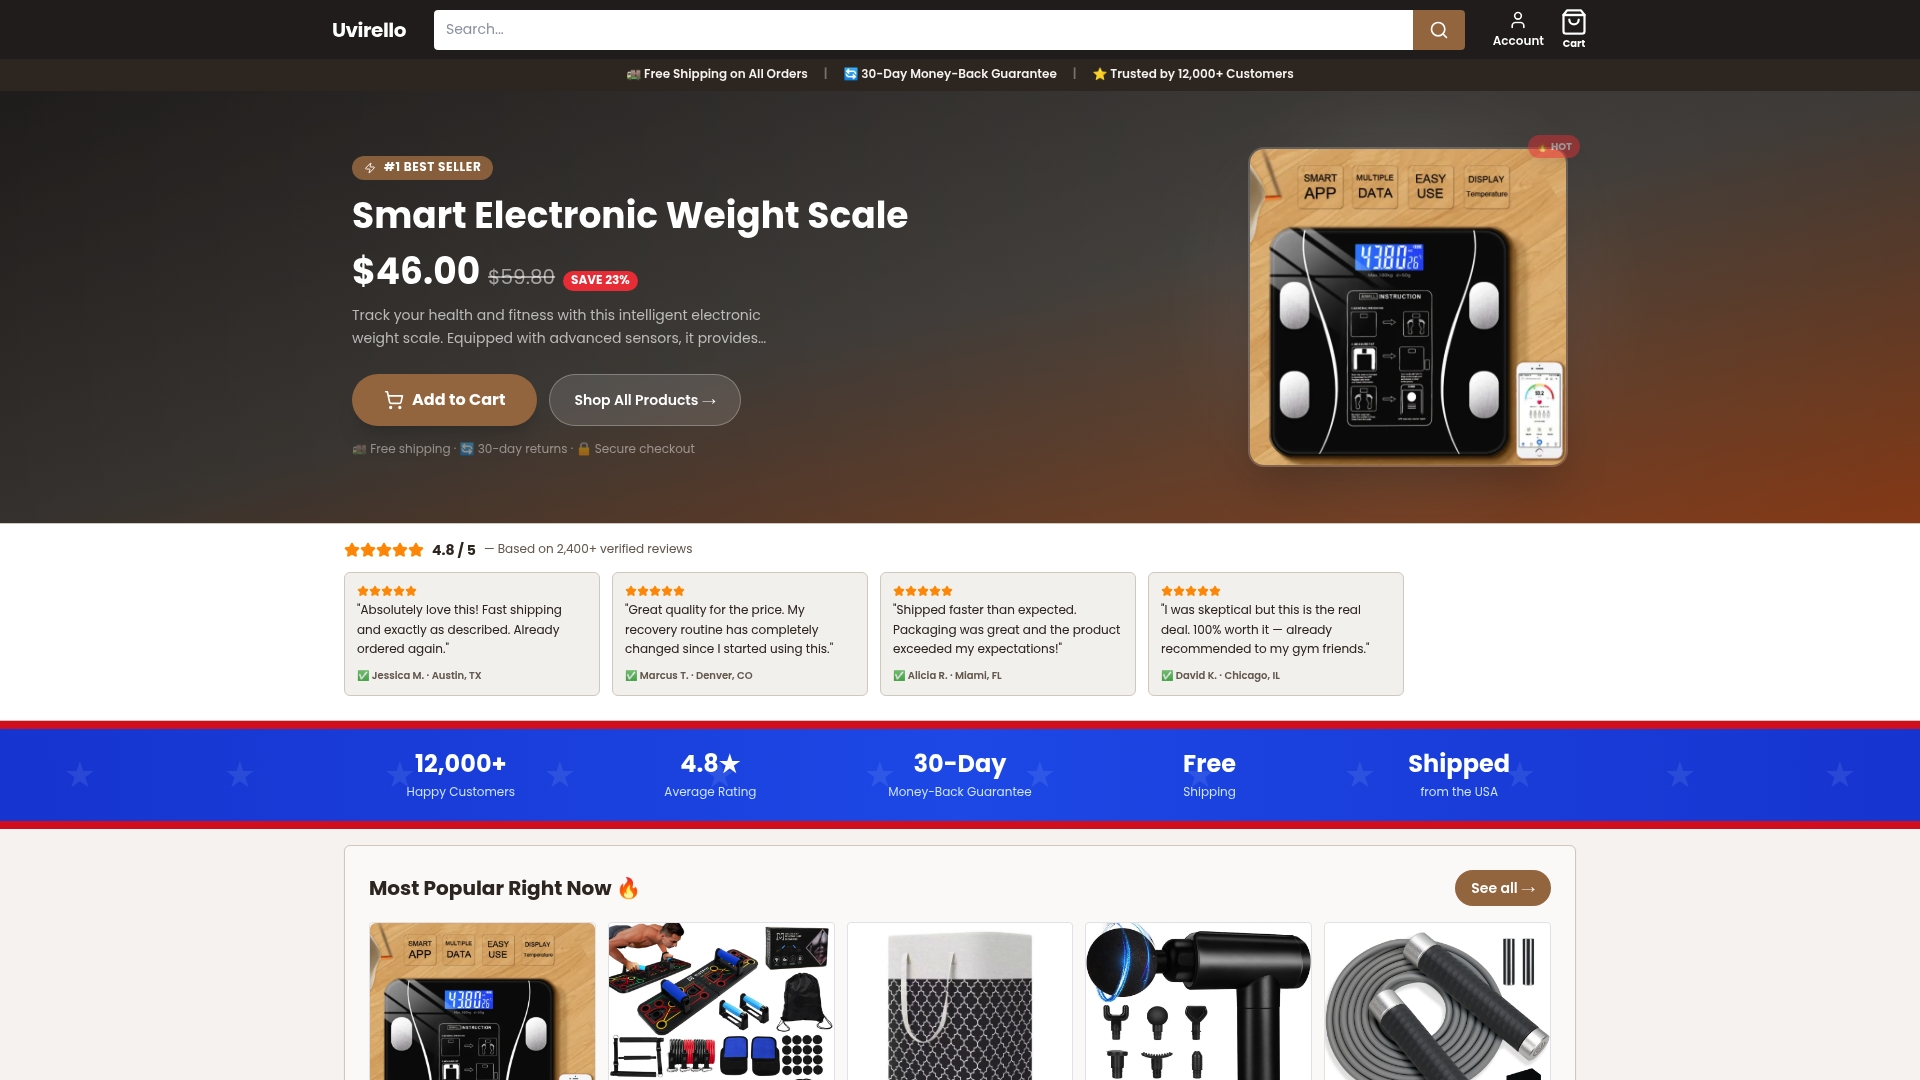
The Uvirello Smart Electronic Weight Scale is built for exactly that use case. Its high-precision sensors deliver consistent multi-metric readouts — body fat percentage, total body water, skeletal muscle mass, visceral fat estimate, BMR, and more — in a single morning weigh-in. The sleek, minimal design fits any bathroom without looking like medical equipment, and the interface is straightforward enough that you get your numbers and move on with your day.
For a 12-week strength program, tracking skeletal muscle mass and fat mass week over week gives you the feedback loop that keeps training decisions grounded in data rather than guesswork; many modern gyms rely on Fitness Flow to integrate body composition insights directly into coaching workflows. For someone monitoring cardiometabolic wellness, the visceral fat trend is the number to watch, and Uvirello surfaces it clearly. Over 12,000 customers have rated the scale 4.8 out of 5, which reflects how consistently it performs in real home conditions.
Clinical tests like DEXA and MRI remain the accuracy standard for medical decisions — Uvirello is transparent about that. But for the day-to-day work of tracking body composition trends, a high-precision home scale is the practical, affordable, and repeatable option. Check out the Uvirello smart scale and see which metrics matter most for your goals.
Key Takeaways
Body composition metrics give you a far more useful picture of health and fitness than weight or BMI alone — and the most important skill is learning to read trends, not individual numbers.
| Point | Details |
|---|---|
| Trends beat single readings | Body fat percentage fluctuates daily with hydration and activity; track 4-week rolling averages instead. |
| Visceral fat is the priority metric | Elevated visceral fat carries greater metabolic risk than total body fat percentage and deserves separate monitoring. |
| Match your method to your goal | Consumer BIA scales are reliable for trend tracking; DEXA or clinical testing is needed for medical-grade precision. |
| Combine metrics with clinical markers | Pair body composition data with blood pressure, fasting glucose, and a lipid panel for a complete health picture. |
| Uvirello for at-home tracking | The Uvirello smart scale delivers consistent multi-metric readouts — fat %, muscle mass, visceral fat, and TBW — for practical trend-based monitoring. |
The numbers are only as useful as the habits behind them
Here is the honest practitioner's view: most people who start tracking body composition make the same mistake. They treat the first reading as a verdict and the second reading as a crisis or a victory, depending on which direction it moved. Neither reaction is warranted.
Body composition data is genuinely useful when it informs decisions over weeks and months, not when it drives anxiety over daily fluctuations. The clients who get the most out of tracking are the ones who set a consistent measurement routine, pick two or three metrics that align with their actual goals (usually fat mass, skeletal muscle mass, and visceral fat), and then adjust their training and nutrition based on four-week trends rather than Tuesday's reading.
The other thing worth saying plainly: no body composition metric tells you how to feel about your body. These numbers are tools for making better decisions about training, nutrition, and when to seek clinical input. A visceral fat score that is trending down over three months while skeletal muscle mass holds steady is a program working, regardless of what the absolute body fat percentage says. That is the frame worth keeping.
For deeper reading on how to build a tracking habit that actually sticks, the Uvirello blog on fitness progress quantification is a practical next step.
Sources and further reading
The following sources informed this guide. Each is noted for what it contributes most.
-
Harvard Health: What is a healthy body fat percentage? — Practical consumer-facing guidance on body fat ranges, daily fluctuation, and why trends matter more than single readings. Best for: general reference ranges and measurement context.
-
Harvard T.H. Chan School of Public Health: Measuring Body Fat — Detailed overview of BMI limitations, waist circumference, and measurement methods including DEXA, hydrostatic weighing, BIA, and skinfolds. Best for: clinical and methodological detail on each measurement technique.
-
Verywell Health: Body Composition — Definition and Insights Into Health — Clear consumer-facing definition of body composition and how it differs from weight-based metrics. Best for: introductory definitions and the fat vs. fat-free mass distinction.
-
Healthline: How to Improve Body Composition, Based on Science — Evidence-based overview of measurement methods, the role of strength training in improving lean mass, and practical lifestyle strategies. Best for: actionable improvement strategies and method comparisons.
-
Men's Health: What Your Body Composition Metrics Actually Say About Your Health — Accessible explanation of BIA sensitivity to hydration and the practical limits of consumer devices. Best for: understanding BIA error sources and consumer device limitations.
-
Acibadem International: Body Fat Percentage — What Patients Need to Know — Clinical perspective on visceral fat risk, metabolic syndrome, and why body composition should be combined with clinical markers. Best for: visceral fat clinical relevance and the case for combining metrics with medical evaluation.
-
Wikipedia: Body Fat Percentage — Broad overview of measurement methods including DEXA, hydrostatic weighing, and BIA with technical detail. Best for: method-by-method technical reference.
-
NIH/PMC: Current Body Composition Measurement Techniques — Peer-reviewed clinical review of body composition measurement methods, accuracy, and appropriate use cases. Best for: clinical and research-grade detail on method accuracy and validation.
-
University of New Mexico: Understanding Body Composition — Academic overview of body composition models, health risks of excess fat, and the distinction between leanness and thinness. Best for: foundational academic context on body composition models and health risk.
-
Uvirello Smart Scale — At-home smart scale with high-precision sensors reporting body fat %, skeletal muscle mass, visceral fat estimate, TBW, and BMR. Practical option for consistent trend-based tracking.
This article is general health information, not medical advice. Consult a qualified clinician or registered dietitian for guidance specific to your health situation, and verify current clinical guidelines with a primary care provider.