
Fitness progress metrics are defined as the full set of measurable indicators that reveal how your body and health are changing over time. Weight alone is not one of them. 75% of people who rely only on a bathroom scale quit within four weeks, driven off by daily fluctuations caused by hydration and sodium intake. That number is a signal, not a coincidence. Metrics beyond weight tracking give you a fuller, more accurate picture of what is actually happening inside your body. The CDC reports that 6 in 10 U.S. adults have a chronic disease influenced by trackable habits like sleep, physical activity, and nutrition. Tracking those habits directly is more useful than watching a number on a scale bounce up and down.
1. Why metrics beyond weight tracking tell the real story
Body weight changes daily based on water retention, food volume, and hormonal shifts. None of those changes reflect actual fat loss or muscle gain. Fitness experts describe progress as a portfolio of data that includes recovery markers, performance indicators, and body composition measurements. Relying on weight alone creates blind spots that cause people to abandon programs that are actually working. A broader set of wellness indicators removes those blind spots.
2. Body fat percentage and lean muscle mass
Body fat percentage is the share of your total weight made up of fat tissue. Lean muscle mass is everything else: muscle, bone, water, and organs. These two numbers tell you whether you are losing fat, gaining muscle, or both. A person can lose fat and gain muscle simultaneously while the scale stays flat. Without body composition measurements, that progress is invisible.
Common measurement methods include:
- Bioimpedance analysis (BIA): Built into many home scales, including Uvirello. Practical for tracking trends over time.
- DEXA scan: Dual-energy X-ray absorptiometry. The clinical gold standard for body composition accuracy.
- Bod Pod: Air displacement plethysmography. Highly accurate and available at university and sports medicine facilities.
- Tape measure: Waist, hip, and limb circumferences. Inexpensive and surprisingly reliable for tracking fat distribution.
Home bioimpedance scales are useful for trends but less precise than clinical methods. Use them consistently, at the same time of day, under the same conditions, and the trend data becomes meaningful. Waist circumference is one of the most health-relevant measurements you can take. A waist above 35 inches for women or 40 inches for men correlates with elevated cardiovascular and metabolic risk.
Pro Tip: Take monthly progress photos in the same lighting and pose. Clothing fit and photo comparisons often reveal body composition shifts that neither the scale nor BIA captures.
3. Performance metrics that confirm real fitness gains
Strength and cardiovascular performance metrics show fitness improvements that body composition measurements sometimes lag behind. Performance changes typically become visible around weeks 4–6, often before the mirror or scale reflects them. Tracking performance gives you evidence of progress when other metrics are quiet.
Key strength metrics to track:
- Volume load: Sets multiplied by reps multiplied by weight. A rising volume load over weeks confirms strength adaptation.
- Rep max trends: Your five-rep or ten-rep max on key lifts. Easier to test safely than a one-rep max.
- Velocity-based training (VBT): VBT monitors load velocity changes instead of requiring frequent max-effort tests. It detects strength changes as small as 2–3%, making it one of the most sensitive strength tracking methods available.
Cardiovascular performance metrics include:
- Resting heart rate: Checked each morning before getting up. A declining resting heart rate over weeks signals improving cardiovascular fitness.
- Running pace at a fixed effort level: If you run at the same perceived effort and your pace improves, your aerobic system is adapting.
- Recovery heart rate: How quickly your heart rate drops in the two minutes after intense exercise. Faster recovery indicates better fitness.
Pro Tip: Pick two or three performance metrics that match your specific goal and track them every 2–4 weeks. Tracking too many performance numbers at once creates noise, not clarity.
4. Recovery and wellness indicators you should not ignore
Recovery metrics are the most underrated category of non-weight health metrics. Poor sleep raises cortisol levels, and elevated cortisol disrupts the fat-to-muscle loss ratio during a calorie deficit. The CDC recommends at least 7 hours of sleep per night alongside 150 minutes of weekly physical activity. Most people track their workouts and ignore their sleep entirely.
Recovery and wellness indicators worth tracking consistently:
- Sleep duration and quality: Total hours plus subjective quality rating each morning. Even a simple 1–5 scale logged daily reveals patterns.
- Resting heart rate: Doubles as both a fitness marker and a recovery marker. A spike above your baseline after hard training signals incomplete recovery.
- Energy levels and training motivation: Subjective, but reliable. Consistently low energy or dread before workouts is a data point, not a mood. It often precedes overtraining or under-recovery.
- Stress load: Chronic psychological stress elevates cortisol just as poor sleep does. Logging your perceived stress level weekly adds context to other metrics.
Fitness experts recommend a hybrid approach that blends recovery markers with performance and body composition data. That combination gives you a complete health profile instead of a partial one.
5. How to use trend data instead of daily readings
Daily readings of almost any metric are misleading. Weight, resting heart rate, and even mood scores fluctuate for reasons unrelated to your actual progress. The solution is weekly aggregation. Average your daily readings across a week and compare week-over-week trends. That approach filters out the noise and reveals the signal.
Tracking trends over time rather than reacting to single readings is the defining habit of people who sustain long-term progress. A useful personal dashboard contains 4–6 metrics drawn from different categories.
| Metric category | Example metrics | Tracking frequency |
|---|---|---|
| Body composition | Body fat %, waist circumference | Weekly or biweekly |
| Strength performance | Volume load, rep max | Every 2–4 weeks |
| Cardiovascular fitness | Resting heart rate, run pace | Weekly |
| Recovery and wellness | Sleep hours, energy rating | Daily, reviewed weekly |
Pro Tip: Log your metrics in a simple spreadsheet or a fitness tracking app and review the four-week trend, not the day-to-day number. Four weeks of data is the minimum for a meaningful pattern.
6. Choosing the right metrics for your specific goal
Not every metric applies equally to every person. Combining body composition metrics with performance indicators confirms that weight loss represents fat loss rather than muscle loss. The right metric set depends on what you are actually trying to achieve.
For fat loss:
- Waist circumference and body fat percentage (primary)
- Sleep quality and energy levels (secondary)
- Avoid tracking scale weight daily. Weekly averages only.
For muscle gain and strength:
- Volume load and rep max trends on your main lifts
- Protein intake as a proxy for muscle-building conditions
- Body fat percentage to confirm you are gaining muscle, not just weight
For cardiovascular endurance:
- Resting heart rate as a baseline fitness marker
- Running pace or cycling power at a fixed effort level
- Recovery heart rate after high-intensity intervals
For stress management or high training loads:
- Sleep quality is the top priority
- Resting heart rate variability (HRV) if your device supports it
- Perceived energy and motivation scores logged daily
Budget matters too. DEXA scans and Bod Pod sessions cost money and require appointments. Tape measurements, clothing fit checks, and a quality smart scale like Uvirello cover the essentials at a fraction of the cost. Uvirello measures body fat percentage and BMI using high-precision sensors, giving you body composition data at home without a clinic visit. Over 12,000 customers rate it 4.8 out of 5, which reflects consistent real-world reliability.
Key takeaways
Tracking fitness progress through a dashboard of body composition, performance, recovery, and wellness metrics produces better results and better motivation than weight alone.
| Point | Details |
|---|---|
| Weight is unreliable alone | Daily fluctuations from hydration and sodium make scale-only tracking misleading. |
| Body composition beats body weight | Body fat percentage and waist circumference reveal fat loss and muscle gain that weight hides. |
| Performance metrics confirm progress | Volume load, rep max trends, and resting heart rate show fitness gains before the mirror does. |
| Recovery metrics protect your results | Sleep quality and energy levels directly affect cortisol, fat loss, and muscle retention. |
| Track trends, not daily readings | Weekly averages across 4–6 metrics give you a reliable signal and filter out daily noise. |
Why I stopped trusting the scale and started trusting the data
My honest case for multi-metric tracking
I spent two years watching the scale and feeling like I was failing. My weight barely moved across a six-month training block. What I did not see was that my waist had dropped two inches, my resting heart rate had fallen from 68 to 57 beats per minute, and my squat volume had nearly doubled. The scale showed nothing. The other metrics showed everything.
The mistake most people make is treating the scale as a report card. It is not. It is one data point in a much larger set. When I started logging sleep quality, weekly waist measurements, and my five-rep max alongside my weight, the picture became clear and, more importantly, motivating. Progress was happening. I just could not see it through a single lens.
The other trap I see constantly is metric overload. Tracking 12 things at once creates anxiety, not clarity. Pick one metric from each category: body composition, performance, recovery, and wellness. Four numbers, reviewed weekly, tell you more than 12 numbers reviewed obsessively every day.
The most practical non-scale metrics are also the simplest: a tape measure, a morning heart rate check, and an honest sleep rating. You do not need expensive lab tests to build a useful dashboard. You need consistency and the willingness to look at the full picture.
— Jacob
Uvirello makes multi-metric tracking practical at home
Tracking body composition, performance, and recovery metrics sounds like a lot of work. Uvirello reduces that burden by delivering body fat percentage, BMI, and related body composition data in a single weigh-in.
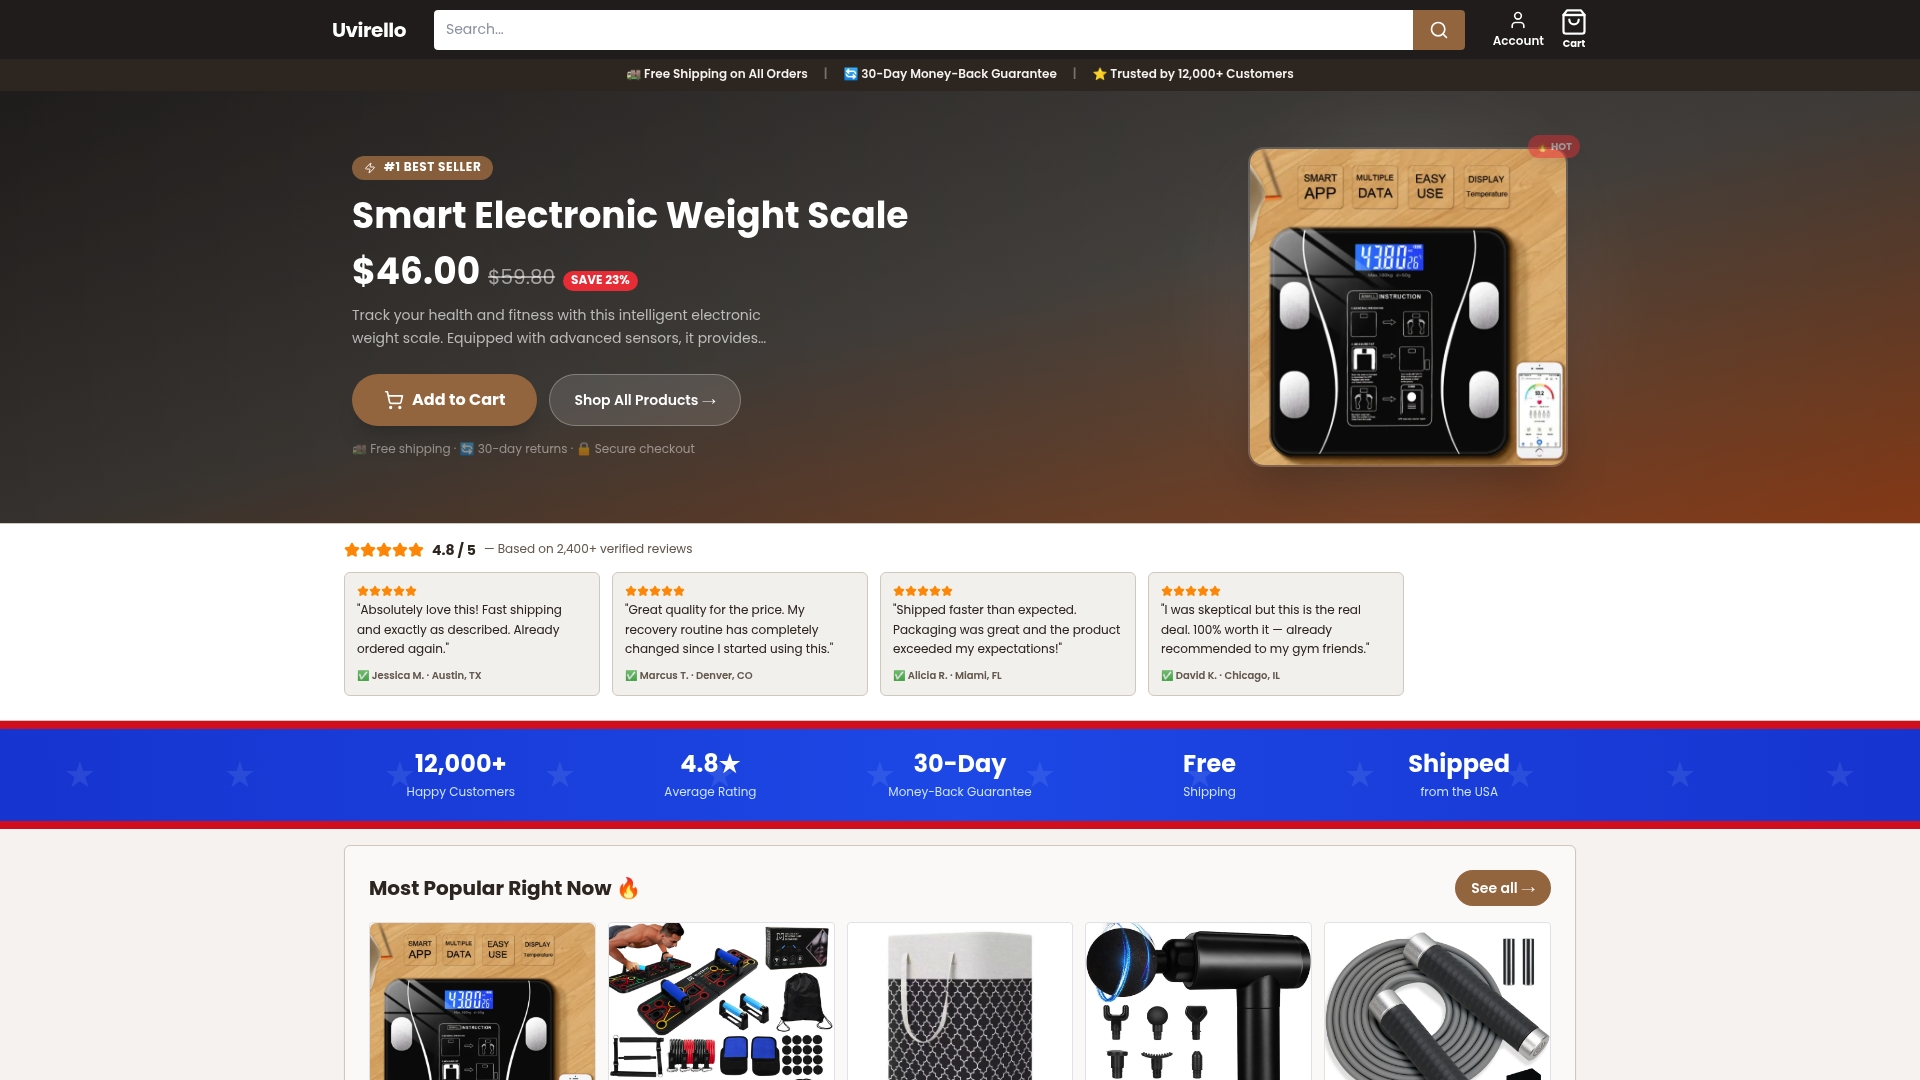
The Uvirello Smart Electronic Weight Scale uses high-precision sensors to give you consistent, repeatable readings you can actually trust for trend analysis. Pair it with a simple log of your sleep rating, waist measurement, and key lift numbers, and you have a complete personal health dashboard without a clinic visit or a complicated app. Over 12,000 people already use it as the foundation of their tracking system. If you want body composition data at home without guesswork, Uvirello is the place to start.
FAQ
What are the best non-weight fitness progress metrics?
Body fat percentage, waist circumference, resting heart rate, sleep quality, and strength volume load are the most reliable non-weight fitness progress metrics. Each captures a different dimension of health that the scale cannot measure.
How often should I track fitness metrics beyond weight?
Track body composition metrics weekly or biweekly, performance metrics every 2–4 weeks, and recovery indicators like sleep and energy levels daily. Review weekly averages rather than reacting to single readings.
Why does weight fluctuate so much day to day?
Daily weight changes by 1–5 pounds based on water retention, sodium intake, food volume, and hormonal shifts. None of those changes reflect actual fat or muscle change, which is why weekly trend averages are more useful than daily readings.
Can a home scale measure body composition accurately?
Home bioimpedance scales provide useful trend data when used consistently under the same conditions. They are less precise than clinical methods like DEXA, but accurate enough for tracking direction and rate of change over time.
What is the easiest way to start tracking metrics beyond weight?
Start with three metrics: waist circumference, resting heart rate, and a daily sleep quality rating. Add body fat percentage from a smart scale like Uvirello. Review the four-week trend before drawing any conclusions.