
Fitness progress quantification is defined as the systematic measurement of physical change using multiple objective and subjective markers tracked over time. A single number on a scale tells you almost nothing useful. Tracking 3–5 distinct markers gives a far more accurate picture of what your body is actually doing. The industry term for this approach is multi-metric assessment, and it is the standard recommended by fitness professionals for anyone serious about understanding their results. This guide breaks down each method, explains when to use it, and shows you how to build a system that works.
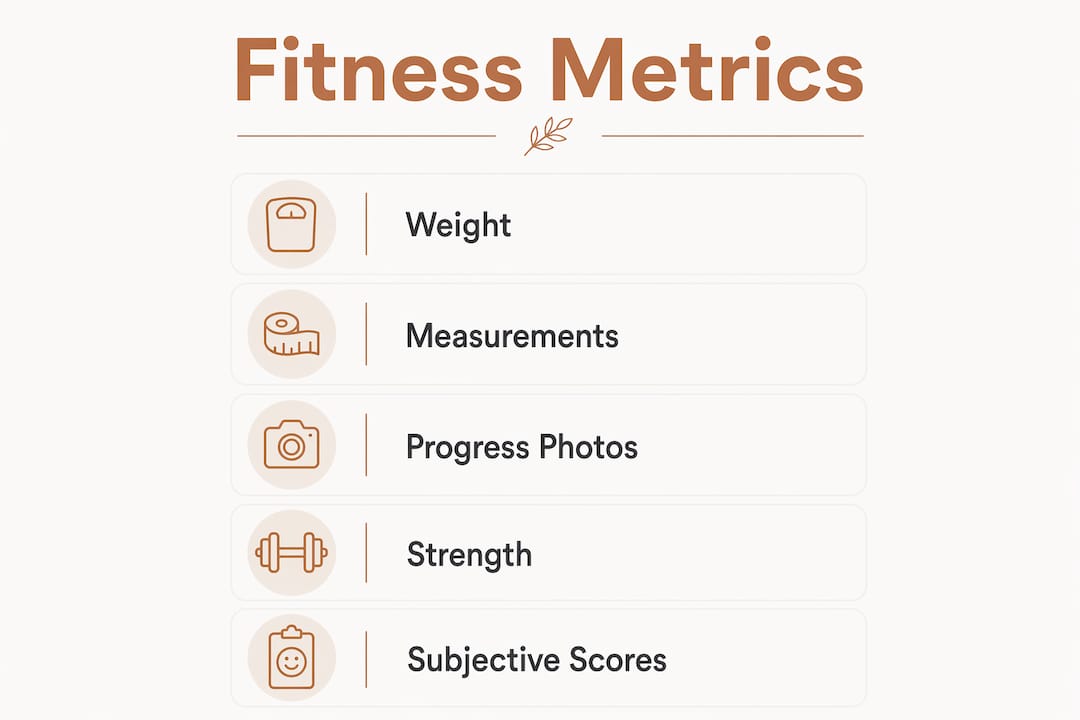
How fitness progress is quantified: the core framework
Multi-metric assessment combines objective data, things you can measure with a device, with subjective data, things you feel and rate yourself. Neither type alone is sufficient. A person can lose significant body fat while their scale weight stays flat because muscle gain offsets the loss. Without waist measurements or progress photos, that person would conclude they made no progress. That conclusion would be wrong.
The most reliable objective markers are weekly averaged body weight, waist circumference, standardized progress photos, and strength performance data. The most reliable subjective markers are daily or weekly ratings of sleep quality, energy, and mood on a 1–10 scale. Together, these inputs give you a complete signal rather than a fragment of one.
Pro Tip: Start with three metrics before adding more. Complexity kills consistency, and consistency is what produces usable data.
What are the objective metrics used to quantify fitness progress?
Objective metrics are measurable, repeatable, and independent of how you feel on a given day. That independence is exactly what makes them valuable.
Body weight: weekly averages, not daily readings
Body weight is the most commonly tracked metric and the most commonly misread one. Daily weight fluctuates by 1–2 kg based on hydration, food volume, and sodium intake. Acting on a single morning reading is like judging a stock by one hour of trading. Weigh yourself daily, then average the readings across the week. That weekly average is your data point, not any individual reading.
For women, body weight can vary by 1–3 kg across the menstrual cycle due to water retention. A four-week average removes that hormonal noise and reveals the actual fat loss trend underneath.
Waist circumference and body measurements
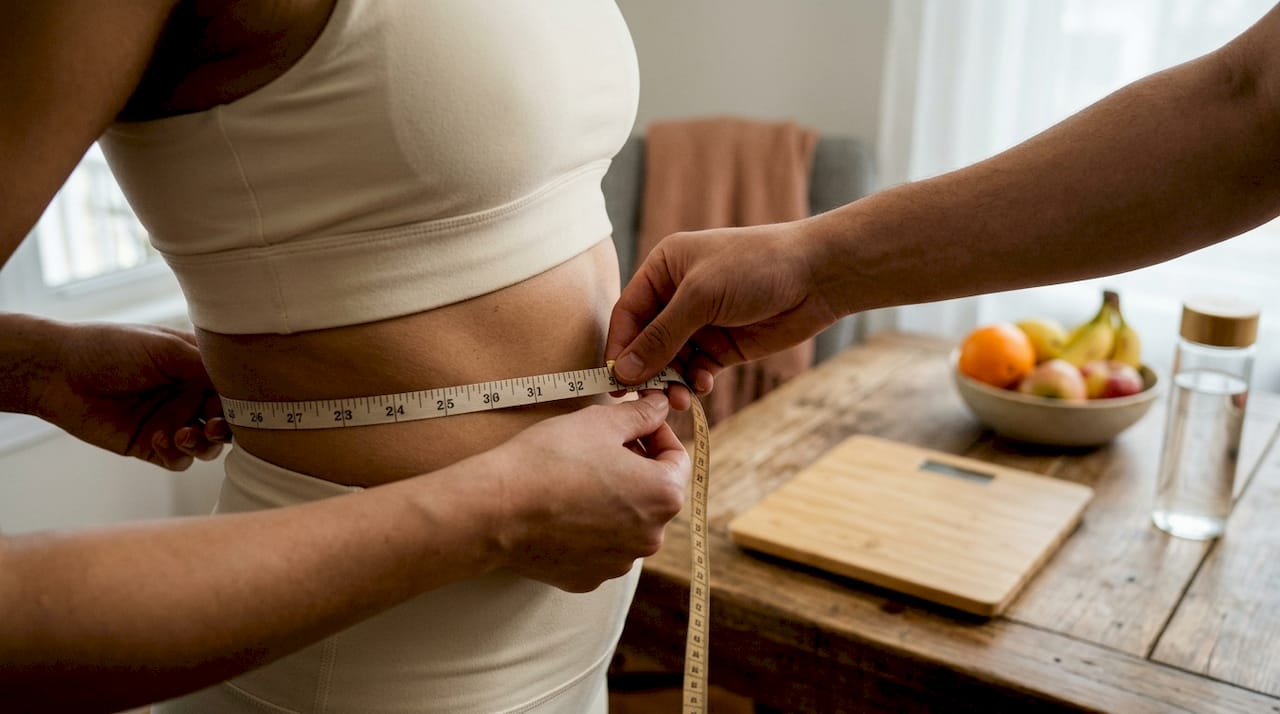
Waist circumference is one of the most reliable indicators of fat loss because it reflects visceral fat reduction directly. Measure at the narrowest point of your torso, always in the same spot, always in the morning before eating. Hip, thigh, and chest measurements add further context for people focused on body composition rather than weight alone.
Progress photos
Progress photos capture changes that measurements miss, particularly muscle definition and postural shifts. Take them every four weeks under identical conditions: same lighting, same time of day, same clothing, same distance from the camera. Side-by-side comparisons across eight to twelve weeks reveal changes that feel invisible week to week.
Strength and performance metrics
Tracking workout volume, calculated as sets multiplied by reps multiplied by weight, is a reliable indicator of progressive overload. If your volume on the squat increases over six weeks, your body is adapting. Strength improvements are also leading indicators. Performance gains precede visible body changes by roughly two to four weeks, which means your lifts going up is the earliest signal that your program is working.
You can also estimate your one-rep maximum using the Epley formula without ever attempting a dangerous maximal lift. The formula is: weight lifted multiplied by (1 plus reps divided by 30). Tracking that estimated figure over time gives you objective strength data with minimal injury risk.
| Metric | Measurement tool | Recommended frequency |
|---|---|---|
| Body weight | Scale | Daily, averaged weekly |
| Waist circumference | Tape measure | Monthly |
| Progress photos | Camera or phone | Every 4 weeks |
| Workout volume | Training log | Every session |
| Estimated 1RM | Epley formula | Every 4–6 weeks |
How do subjective metrics add context to objective data?
Subjective metrics explain the "why" behind your objective numbers. Without them, a flat week on the scale or a poor training session looks like failure. With them, you can see that you slept four hours, were under high work stress, and ate poorly. The data point is not a failure. It is a predictable outcome of known inputs.
Rate the following on a 1–10 scale each day or each week:
- Sleep quality: How rested did you feel when you woke up?
- Energy levels: How much physical and mental energy did you have through the day?
- Mood and motivation: How willing were you to train and stay on plan?
- Hunger and appetite: Were cravings manageable or overwhelming?
Subjective scoring alongside objective data provides critical context for interpreting performance trends. A week where your squat drops 5% but your sleep score averaged 4 out of 10 tells a very different story than the same drop with a sleep score of 8.
Pro Tip: Log your Rate of Perceived Exertion (RPE) for each working set. RPE is a 1–10 scale of how hard a set felt. If you lift the same weight at a lower RPE over time, that is objective evidence of improved efficiency, even if the number on the bar has not changed.
Viewing effort via RPE alongside lifted weight confirms progressive overload by showing that your body is handling the same load more easily. That is progress, even when the weight stays the same.
What tracking frequencies give the most accurate results?
Measurement frequency determines whether you collect signal or noise. The wrong cadence produces data that misleads rather than informs.
- Weigh daily, report weekly. A single morning reading is noise. Seven readings averaged together are signal. Never make a program change based on one weigh-in.
- Take measurements monthly. Waist and body measurements change slowly. Measuring weekly creates anxiety without adding information.
- Photograph every four weeks. Visual changes require time to accumulate. Monthly photos give enough gap to see real differences.
- Reassess fitness benchmarks every 4–12 weeks. Reassessment intervals of 4–12 weeks distinguish meaningful physiological adaptation from normal daily variance. Testing your conditioning or strength more often than that produces unreliable comparisons.
- Review subjective scores weekly. Weekly averages of sleep, energy, and mood scores reveal patterns that daily readings obscure.
Consistency in measurement conditions outweighs device precision for useful trend tracking. Using the same scale, at the same time of day, on the same surface, every single day is more valuable than using a laboratory-grade device randomly. Standardization is the variable that matters most.
Pro Tip: Set a weekly review appointment with yourself, 10 minutes on Sunday morning. Log your weekly weight average, note your subjective scores, and check your training volume trend. That one habit produces more clarity than any tracking app used inconsistently.
For more on building a reliable cadence, weekly tracking best practices covers the recommended rhythms in detail.
What are the most common mistakes in quantifying fitness progress?
The most common mistake is treating scale weight as the primary verdict on progress. Scale weight is a lagging, noisy indicator. It reflects water, food mass, hormonal shifts, and glycogen storage, not just fat and muscle. Relying on it alone causes people to abandon programs that are actually working.
Fitness progress rarely moves in a straight line. It follows a staircase pattern: rapid improvement phases alternate with flat or maintenance periods. Reacting to a flat week as if it signals failure ignores the underlying trend. The trend is the truth. The individual data point is just one step on the staircase.
The second most common mistake is collecting too many metrics too often without standardization. Tracking ten variables daily sounds thorough. In practice, it produces confusion and dropout. Three to five metrics, measured consistently, yield far more useful information than ten metrics measured sporadically.
Other frequent errors include:
- Changing programs too soon. Four weeks is rarely enough time to see body composition changes. Eight to twelve weeks is the minimum for a fair assessment.
- Ignoring performance data. People who track only weight miss the strength gains that signal real adaptation.
- Comparing to others. Your baseline, your rate of adaptation, and your goals are specific to you. External comparisons corrupt your interpretation of your own data.
Measuring fitness progress objectively leads to higher goal attainment than relying on feeling alone. The data keeps you honest when motivation dips and confident when the mirror lags behind the numbers.
Pro Tip: If you feel stuck, pull up your training log from eight weeks ago. Compare volume, weights, and subjective scores. Progress that felt invisible often becomes obvious across that time span.
How do you build your own fitness progress tracking system?
A personal tracking system works when it is simple enough to maintain and specific enough to be meaningful. Build yours in five steps.
- Choose your goal-aligned metrics. Fat loss goals call for weight averages, waist measurements, and photos. Strength goals call for estimated 1RM and workout volume. Endurance goals call for pace, distance, and heart rate at a given effort. Pick the metrics that match what you are actually trying to change.
- Gather your tools. A bathroom scale, a soft tape measure, a phone camera, and a training log cover 90% of what you need. Wearable calorie estimates often lack precision, so treat them as supplementary rather than primary data sources.
- Set your measurement schedule. Use the cadences above: daily weigh-ins, monthly measurements, four-week photos, and weekly subjective scores.
- Log immediately after measuring. Memory degrades fast. A note in a phone app or a paper log taken right after the measurement is far more accurate than a recalled entry later.
- Review trends, not points. Focusing on long-term trends rather than day-to-day readings is the single most important habit in fitness tracking. A three-week downward trend in waist circumference means far more than any single measurement.
Adjust your program based on what the trend data shows, not what a single bad week suggests. If volume is increasing and waist is decreasing over eight weeks, the program is working. Stay the course.
Key Takeaways
Accurate fitness progress quantification requires tracking 3–5 complementary metrics consistently over 8–12 weeks, interpreting trends rather than reacting to individual data points.
| Point | Details |
|---|---|
| Use multiple metrics | Track weight averages, waist circumference, photos, strength volume, and one subjective score together. |
| Average weight weekly | Daily weigh-ins averaged across seven days remove noise and reveal the true trend. |
| Reassess every 4–12 weeks | Meaningful physiological adaptation takes time; short reassessment windows produce misleading comparisons. |
| Subjective scores add context | Rating sleep, energy, and mood explains why objective numbers fluctuate and prevents false conclusions. |
| Trends beat single readings | A consistent three-week direction in your data is always more meaningful than any one measurement. |
Why I think most people track fitness the wrong way
The most common tracking mistake I see is not laziness. It is misplaced precision. People buy expensive wearables, log every calorie, and weigh themselves twice a day, then quit after three weeks because the data feels chaotic and discouraging.
The real problem is that they are reacting to noise instead of reading signal. A scale reading that jumps 1.5 kg overnight after a salty dinner is not a fat gain event. It is water. But without the context of a weekly average and a subjective log showing "ate out, high sodium," that number feels like a verdict.
What I have found actually works is radical simplicity combined with patient interpretation. Three metrics. Consistent conditions. A weekly review. That is it. The people who stick with tracking long enough to see real results are almost never the ones with the most sophisticated systems. They are the ones with the most consistent habits.
Progress follows a staircase, not a ramp. You will have weeks where nothing moves. Then you will have a week where three metrics shift at once. The only way to see that pattern is to keep collecting data through the flat periods without panicking. Patience is not a soft skill in fitness tracking. It is a measurement strategy.
— Jacob
Uvirello makes body composition tracking straightforward
Knowing which metrics matter is only half the equation. Having a reliable tool to capture them is the other half.
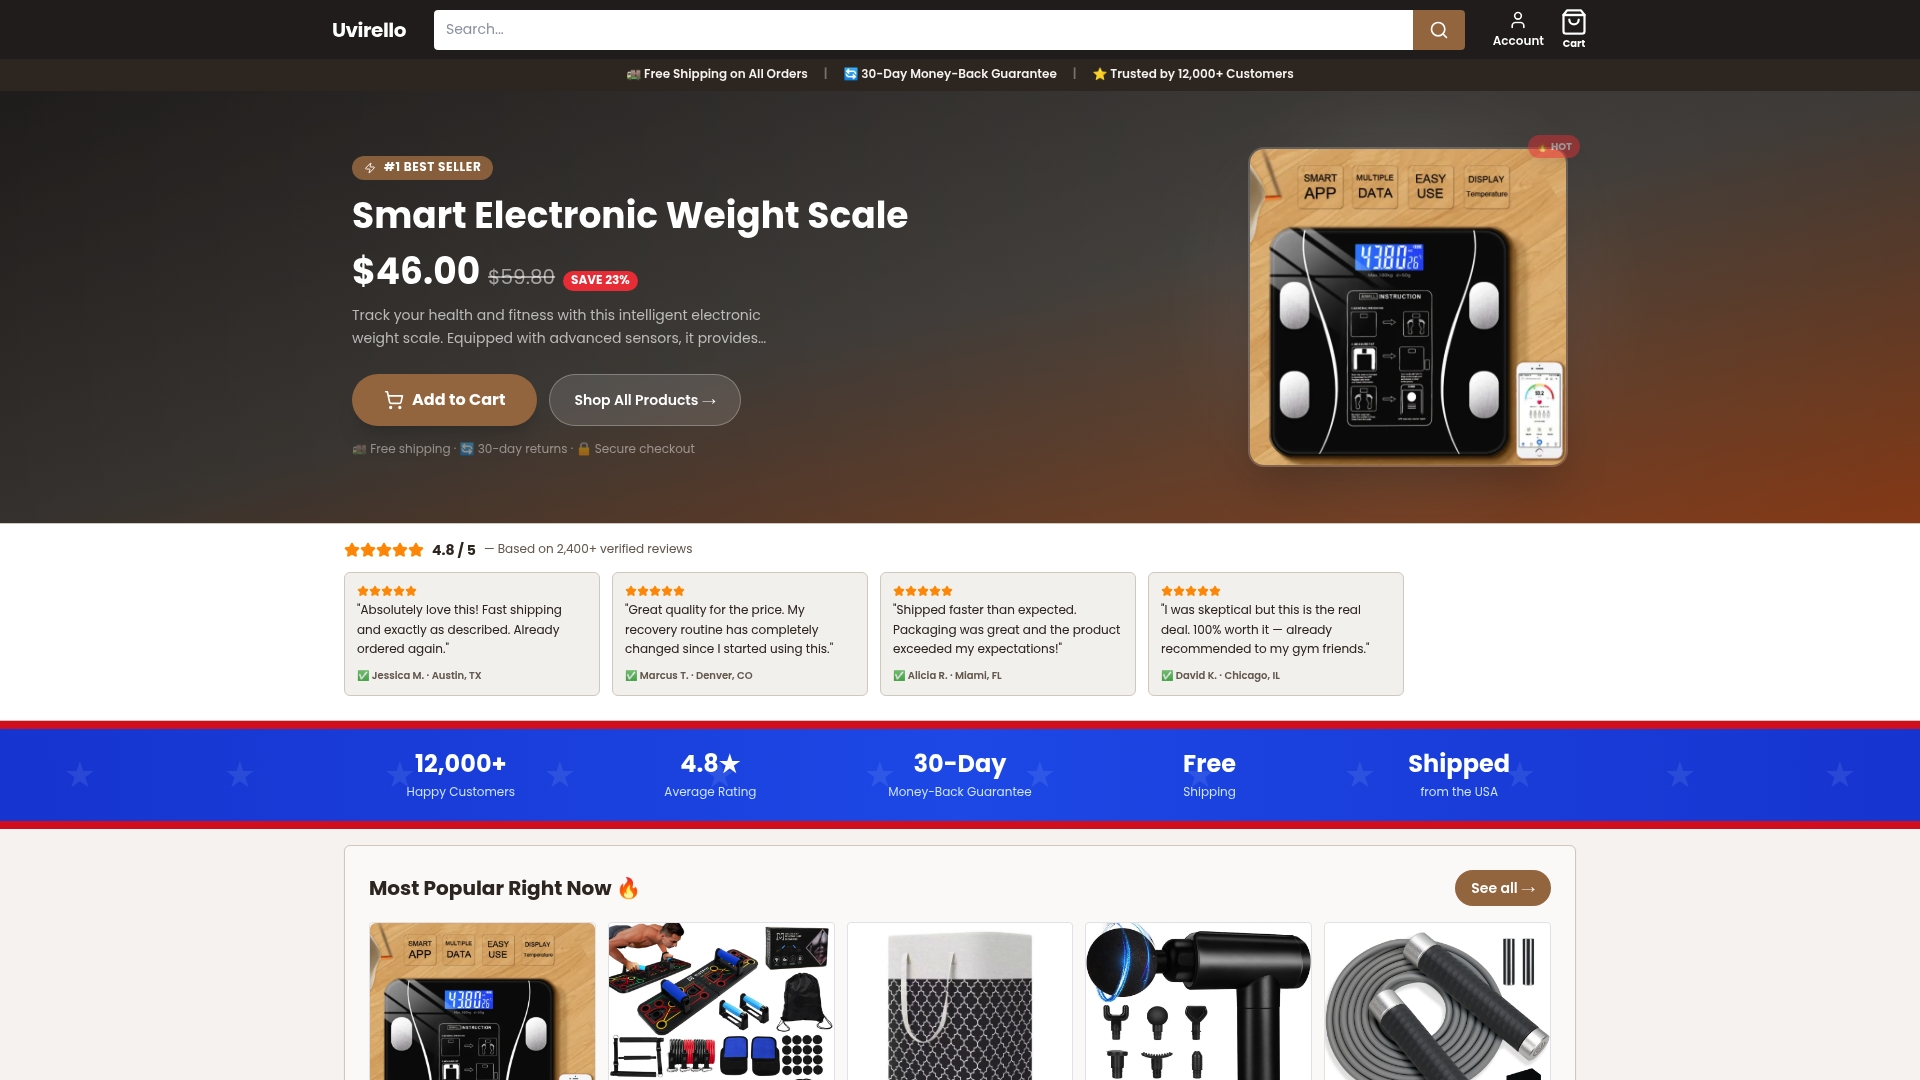
The Uvirello Smart Electronic Weight Scale goes beyond basic weight readings by delivering body composition metrics including body fat percentage and BMI in a single measurement. Over 12,000 customers have rated it 4.8 out of 5, citing the accuracy and ease of use as the primary reasons they kept tracking long enough to see results. For anyone building a multi-metric fitness tracking system, Uvirello provides the body weight and composition data that anchors the whole approach. Pair it with a tape measure, a phone camera, and a training log, and you have everything you need to track fitness results with real confidence.
FAQ
How many metrics should I track for fitness progress?
Track 3–5 distinct markers for the most accurate view of progress. Common choices include weekly weight average, waist circumference, progress photos, workout volume, and one subjective score.
How often should I reassess my fitness progress?
Reassessment intervals of 4–12 weeks are recommended to distinguish real physiological adaptation from normal daily variance. Testing more frequently than that produces comparisons that are too noisy to act on.
Why does my weight fluctuate so much day to day?
Daily weight changes reflect water retention, food mass, sodium intake, and hormonal shifts, not fat gain or loss. Averaging seven daily readings into a weekly figure removes that noise and shows the actual trend.
What is RPE and why does it matter for tracking?
Rate of Perceived Exertion (RPE) is a 1–10 scale rating how hard a set or session felt. Lifting the same weight at a lower RPE over time confirms improved fitness efficiency, even when the load has not increased.
Is scale weight a reliable indicator of fat loss?
Scale weight is a lagging and noisy indicator on its own. Pairing it with waist measurements and progress photos gives a far more accurate picture of actual body composition changes over time.