
Track multiple reliable signals, standardized circumference measurements, repeatable performance tests, subjective daily logs, and occasional lab markers, and judge progress by trends rather than single weigh-ins. The single rule that matters most: use a 7-day rolling average for weight, check other metrics on a 3 to 12 week cycle, and don't change your program until at least three signals move in the same direction.
The most useful non-scale indicators fall into a few clear buckets:
- Standardized body circumferences (waist, hips, chest, arms, thighs)
- Body composition trends (body fat percentage, tracked over weeks, not days)
- Strength and endurance tests you can repeat exactly
- Progress photos and how one specific piece of clothing fits
- Daily subjective ratings: energy, sleep, soreness, mood
- Periodic clinical markers: blood pressure, lipids, A1c, resting heart rate
The rest of this piece walks through exactly how to measure each one, how often to retest, and how to combine them into a plan you can actually stick to for a full 12 weeks.
Key Takeaways
Progress beyond the scale is best measured through trends across circumferences, performance tests, subjective logs, and clinical markers, combined and reviewed on a multi-week cycle.
| Point | Details |
|---|---|
| Use trends, not single readings | Track a 7-day rolling average for weight and 3 to 12 week checkpoints for other metrics. |
| Standardize every measurement | Same time of day, same landmarks, same tape tension, and consistent photo conditions. |
| Retest performance regularly | Check endurance every 3 to 6 weeks and strength every 4 to 8 weeks for a real signal. |
| Wait for three signals to agree | Don't change your program until at least three tracked metrics move the same direction. |
| Anchor goals to process, not just outcome | Set a daily or weekly behavior goal under each outcome target to stay consistent during plateaus. |
| Pair a smart scale with other signals | The Uvirello Smart Electronic Weight Scale tracks weight, body fat percentage, and BMI trends to combine with circumference and performance data. |
This article is general information, not a substitute for advice from a qualified doctor. Consult a qualified healthcare professional about your own circumstances before acting on anything here.
Table of Contents
- How Do You Measure Progress Beyond Scale Numbers With Body Circumferences?
- What Do Body Fat Percentage and Smart Scale Readings Actually Tell You?
- Which Strength and Endurance Tests Show Real Capability Gains?
- How Do You Track Energy, Sleep, and Recovery Day to Day?
- Do Progress Photos and Clothing Fit Actually Prove Anything?
- Which Health Markers Reflect Real Progress?
- How Do You Build a Simple 12-Week Tracking Plan?
- What Measurement Mistakes Cause the Most False Alarms?
- How Can a Smart Scale Support Trend-Based Tracking?
- Why Does Motivation Matter as Much as the Measurements?
- How Do SMART Goals and Process Goals Fit Into Progress Tracking?
- Why Capability Beats a Single Daily Number
- Track Your Trends With a Tool Built for It
- Sources
How Do You Measure Progress Beyond Scale Numbers With Body Circumferences?
Circumference measurements catch changes in body composition that the scale misses entirely, especially when you're gaining muscle while losing fat. The key is standardizing your technique so week 6 is actually comparable to week 1.
Landmarks to use:
- Waist: at the navel, or the narrowest point between your ribs and hip bones
- Hips: at the widest part of your glutes
- Chest: at the fullest point, tape level across your back
- Thighs and arms: at the midpoint between two joints (mark it with a small dot if you need to)
Measure at the same time of day (mornings, before eating, work best), in minimal clothing, with the tape snug but not compressing skin. Take two readings and average them if they differ by more than a quarter inch.
Real change usually shows up as a noticeable reduction at the waist over several weeks for someone in a moderate calorie deficit. Anything less over a shorter window is likely noise.
Pro Tip: Keep a cheap fabric tape measure in the same drawer as your toothbrush. The habit sticks better when the tool lives where you'll actually see it.
What Do Body Fat Percentage and Smart Scale Readings Actually Tell You?
Waist circumference is one of the more reliable predictors of health risk, and in some research it rivals BMI for forecasting outcomes because it flags visceral fat loss before total body weight moves at all, according to AARP's review of waist versus BMI research. That's part of why a shrinking waistline, even with a stubborn scale, is worth paying attention to.

Smart scales estimate body fat using bioelectrical impedance, sending a small current through your body and calculating resistance. That number moves with hydration, recent meals, sodium intake, and even room temperature. A single reading can swing several percentage points in either direction.
> Body fat percentage and other body metrics contain real measurement noise, which is why HealthCentral's guidance on tracking without a scale recommends reading them as trends across weeks, not verdicts from any single day.
- Weigh in and measure body fat at the same time of day, ideally fasted
- Track the weekly average, not the daily number
- Consider a DEXA scan or clinician-administered test if you want a benchmark accurate enough to catch a 1 to 2 percent shift over several months
For deeper context on why these percentages jump around, Uvirello's guide to using health data wisely breaks down the biggest noise sources.
Which Strength and Endurance Tests Show Real Capability Gains?
Weight can plateau for weeks while your body gets measurably stronger and fitter underneath. Performance tests catch that. Pick two or three you can repeat exactly, and log the numbers.
- Push-up max or a 3 to 5 rep max lift: Log the exact load, reps, and your rate of perceived exertion (RPE) each time so you're comparing effort, not just output.
- 12-minute walk or run distance: Same route, same conditions if possible. Distance covered is your score.
- Timed stair climb or submaximal heart rate test: Climb a fixed number of flights and note your heart rate immediately after, or track how long it takes your heart rate to return to baseline.
Retest endurance markers every 3 to 6 weeks. Strength markers respond a bit slower, so 4 to 8 weeks between retests usually gives you a real signal instead of day-to-day variance. Experts who focus on non-scale tracking consistently point to strength, endurance, and subjective feel as the three pillars that catch functional improvement the scale can't show.
How Do You Track Energy, Sleep, and Recovery Day to Day?
Subjective tracking sounds soft until you realize it's often the earliest signal you have, showing up weeks before the mirror or the tape measure catches up. Keep it dead simple: five numbers, thirty seconds, every day.
- Morning energy (1 to 5)
- Sleep hours plus quality (1 to 5)
- Muscle soreness (1 to 5)
- Stress level (1 to 5)
- Workout RPE (1 to 10)
Average each field weekly. A rising energy score and a falling soreness score over three or four weeks usually means your recovery is keeping pace with your training. If sleep quality or energy trends downward for two consecutive weeks despite consistent training, that's your cue to deload, not push harder.
Pro Tip: A five-field log takes less time than reading this paragraph. Do it right after you brush your teeth, so it rides on a habit you already have.
Do Progress Photos and Clothing Fit Actually Prove Anything?
They can, if you control the variables. Standardized conditions matter more here than almost anywhere else in this process: consistent lighting, the same spot in your house, the same three poses (front, side, back), minimal clothing, and the camera at a fixed distance. Shoot every 2 to 4 weeks.
- Pick one reliable garment (a specific pair of jeans works well) and note monthly how it sits: button, zipper, waistband slack
- Log objective details, not vibes: "waistband loose enough for two fingers" beats "feels better"
- Discount any single photo taken right after a hard workout or a high-sodium meal, since water retention and muscle pump distort the picture
Cross-reference photos against your measurements and performance numbers before drawing conclusions.
Which Health Markers Reflect Real Progress?
Blood pressure, lipid panels, A1c, and resting heart rate often improve well before the scale reflects meaningful change, and they're arguably the outcomes that matter most for long-term health. Resting heart rate specifically tends to track both current fitness and future cardiovascular risk, according to Harvard Health's research on resting heart rate.
- Get a baseline panel early, then follow your clinician's recommended cadence, commonly every 3 to 12 months depending on your risk profile
- Visceral fat reduction, tied closely to waist circumference, shows up in these markers even when body weight lags behind, a connection Mayo Clinic's research on belly fat lays out clearly
> A five-point drop in systolic blood pressure or a modest A1c improvement is a genuine clinical win, worth flagging to your doctor even if it looks unremarkable on paper.
Treat any marker moving in the wrong direction as a conversation starter with your physician, not a reason to panic.
How Do You Build a Simple 12-Week Tracking Plan?
Combining everything above sounds like a lot until you realize most of it takes minutes. Here's a bundle that covers every major signal without becoming a second job:
- Daily: five-field subjective log, plus a scale step-on averaged weekly
- Biweekly: waist, hip, and one other circumference measurement
- Monthly: progress photos and a clothing-fit check
- Every 4 to 6 weeks: one strength test and one endurance test
- Baseline and as advised: blood pressure, lipids, A1c through your clinician
The decision rule keeps you from overreacting to noise: if three or more signals improve over a cycle, stay the course. If results are mixed, wait one more full cycle before changing anything. Public-health evaluation frameworks back this approach, recommending a small set of consistent indicators over scattering effort across too many at once, per CDC guidance on program evaluation.
| Week | Action |
|---|---|
| Week 1 | Record baseline: weight, waist, hips, one strength test, one endurance test, photos |
| Week 4 | Recheck circumferences and photos; review subjective log averages |
| Week 6 | Retest strength and endurance; compare against baseline |
| Week 12 | Full recheck: all measurements, tests, photos, and clinical markers if scheduled |
What Measurement Mistakes Cause the Most False Alarms?
Daily weight can swing 2 to 5 pounds from water, sodium, and hormones alone, which is exactly why a single bad morning shouldn't wreck your motivation, per Cleveland Clinic's explanation of daily weight fluctuation. The 7-day rolling average smooths that noise out.
- Inconsistent measurement conditions (different time of day, different clothing, loose tape tension) create false trends
- Comparing a single smart-scale reading against last week's single reading, instead of averages against averages
- Overreacting to one bad data point by overhauling your whole program
Pro Tip: When two signals disagree, like your waist shrinking while the scale average climbs, don't act yet. Collect one more full measurement cycle before you touch anything.
How Can a Smart Scale Support Trend-Based Tracking?
A smart scale earns its place in this plan when you use its output as a trend, not a verdict. The Uvirello Smart Electronic Weight Scale logs body fat percentage and BMI alongside weight, giving you a running dataset instead of a single scary number.
- Pair its readings with your circumference measurements and performance tests for a fuller picture
- Let it generate the weekly averages you'd otherwise calculate by hand
Why Does Motivation Matter as Much as the Measurements?
Numbers only work if you keep collecting them, and motivation is the part most tracking plans ignore. Dr. Robert F. Kushner, a physician who studies obesity treatment, frames the real goal as gaining health rather than simply losing weight, and he points to mood, ease of daily movement, and sleep quality as the motivators that tend to actually sustain behavior change over time, based on his interview with Northwestern University. That reframing matters because scale-only tracking sets up a single point of failure. Miss a target weight by even a pound and the whole effort can feel like it failed, even when your resting heart rate dropped, your five-rep max went up, and your energy log has been climbing for three weeks straight.
Habit formation research generally shows that behaviors stick better when they're tied to identity ("I'm someone who tracks my training") rather than outcome ("I need to lose 20 pounds"). Watching non-scale numbers improve reinforces that identity shift directly. Every time your 12-minute walk distance increases or your waist measurement drops a quarter inch, you get evidence that the behavior is working, independent of what the scale says that morning.
Mindset shifts show up in smaller ways too: reaching for a workout instead of dreading it, noticing you took the stairs without thinking about it, or realizing you haven't checked the scale in four days because you didn't feel the need to. Those moments rarely get logged anywhere, but they're worth noting in the same daily journal you're already using for energy and sleep. A short note field, "anything shift today?", costs ten seconds and often catches the earliest sign that a habit is becoming automatic rather than effortful.
How Do SMART Goals and Process Goals Fit Into Progress Tracking?
Vague goals produce vague tracking. "Get healthier" gives you nothing to measure against, while a SMART goal (specific, measurable, achievable, relevant, time-bound) gives every metric in this article a target to point at. "Increase my 12-minute walk distance by 400 meters in 8 weeks" is testable. "Feel fitter" is not.
The more useful distinction, though, is process goals versus outcome goals. An outcome goal is the destination: a target waist measurement, a body fat percentage, a five-rep max. A process goal is the daily behavior that gets you there: log the subjective five-field journal every morning, do the strength test every six weeks, hit three training sessions a week. Outcome goals tell you where you're headed. Process goals tell you what to actually do on a Tuesday.
Anchoring your plan to process goals matters because outcomes lag behavior by weeks, sometimes months. If your only goal is a number on the scale, a slow week feels like failure even when you did everything right. If your goal is "complete the weekly tracking log," you can succeed on a Tuesday even during a plateau week, and that success compounds. Set one outcome goal for each major metric bucket (composition, performance, subjective, clinical), then set a process goal underneath each one that you control directly. Judge yourself on the process weekly and the outcome monthly.
Why Capability Beats a Single Daily Number
I keep coming back to the same point when people ask why their scale stalled while everything else improved: the scale measures one variable among dozens that shift during real change. Strength, endurance, and trend data tell you more.
Pick three metrics you'll actually maintain, and commit to the full 12-week template before judging anything.
Track Your Trends With a Tool Built for It
Everything in this article works better with consistent data behind it, and that's exactly what the Uvirello Smart Electronic Weight Scale is built to deliver. Its high-precision sensors log weight, body fat percentage, and BMI every time you step on, giving you the raw numbers to average into real trends instead of guessing from memory.
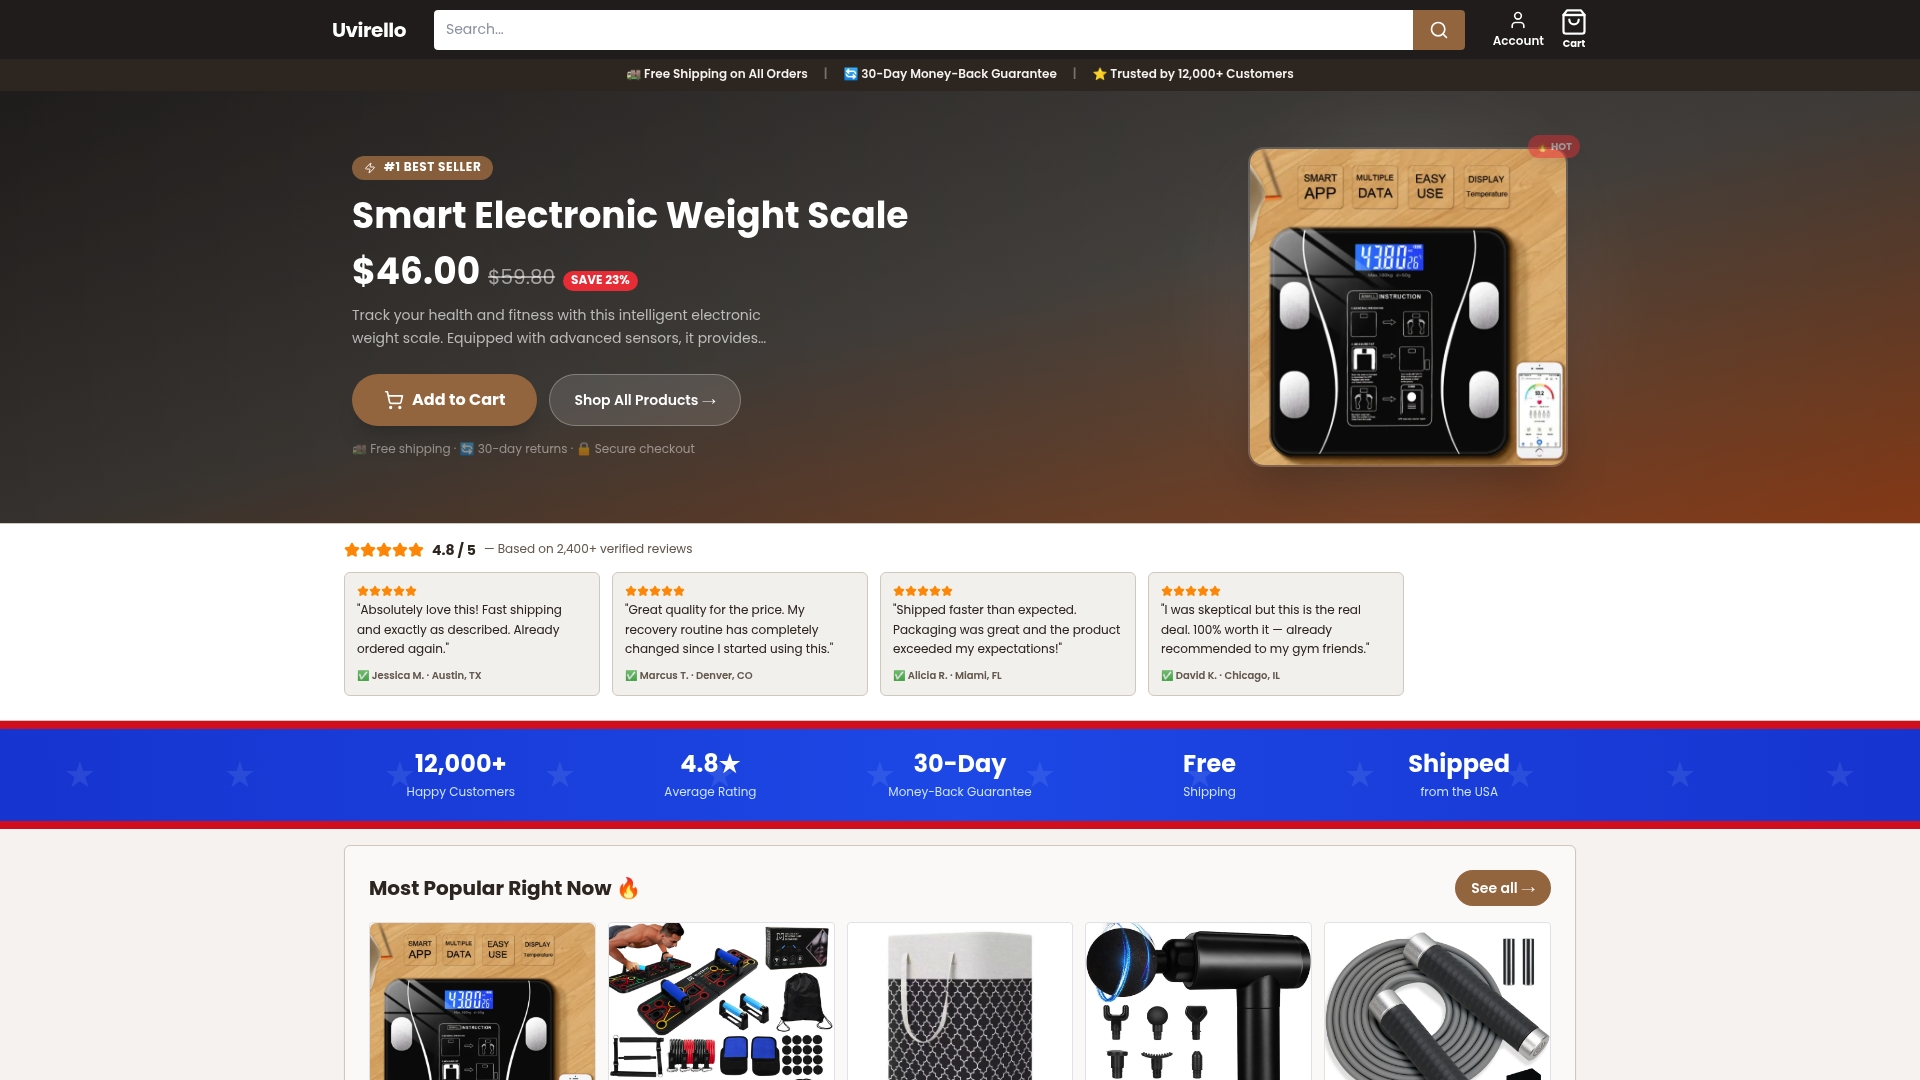
Pair those readings with the circumference measurements and performance tests covered above, and you've got a genuinely complete tracking system, one that catches progress the scale alone would miss entirely. Over 12,000 customers have already built that habit around the scale, with an average rating of 4.8 out of 5. If you're ready to stop guessing at your numbers and start tracking real trends, check out the Uvirello Smart Electronic Weight Scale and see how it fits into your 12-week plan.
Sources
- Ways to Track Progress With Managing Obesity Without Weighing Yourself — HealthCentral
- CDC guidance on indicators and evaluation (MMWR report)
- Belly fat: Why it matters and how to lose it — Mayo Clinic