
Use a consumer smart scale as a trend tracker: take controlled morning readings and read 3–6 month trend lines, not daily numbers. That single shift in mindset turns a bathroom scale into a genuinely useful health tool.
Here's the setup that works from day one:
- Step on the scale every morning, right after using the bathroom, before eating or drinking anything
- Go barefoot, stand on a hard flat surface (not carpet), and use the same device and user profile every time
- Wear minimal clothing or none at all
- Avoid alcohol or intense exercise the evening before if you want a clean reading
- Log the number and move on — don't react to it
Pro Tip: Warm your feet before stepping on. Cold skin raises electrical resistance, which throws off body-composition estimates. Thirty seconds on a warm floor makes a measurable difference.
If you notice a significant, unexplained shift in weight or body fat percentage over several weeks, consult a healthcare provider. Houston Methodist guidance is clear: smart scales are monitoring tools, not diagnostic ones, and a clinician should interpret large or unexpected changes in the context of your medical history.
Key Takeaways
A smart scale used consistently over 3–6 months, combined with waist measurements and strength logs, gives home users a reliable picture of body-composition change that no single reading can provide.
| Point | Details |
|---|---|
| Morning protocol | Step on fasted, post-bathroom, barefoot, on a hard surface, same profile, every time. |
| Weekly cadence | Weekly weigh-ins reduce noise and anxiety while still producing a clear 6–8 week trend. |
| 3–6 month window | Read trend lines, not daily numbers; a sustained 4–8 week directional shift is the signal worth acting on. |
| Complementary metrics | Add waist circumference, strength benchmarks, and monthly photos for a fuller picture than scale data alone. |
| Clinician escalation | Consult a provider for unexplained weight loss over 5% of body weight, persistent lean-mass decline, or any metric change with symptoms. |
Table of Contents
- Why monitoring long-term wellness trends at home actually works
- What your smart scale actually measures
- How to take measurements that actually produce useful data
- How to read your data over months
- What to track alongside your scale
- Why readings sometimes jump — and how to fix it
- What happens to your data in the cloud
- When to call your doctor or dietitian
- The routine that actually sticks
- The Uvirello Smart Electronic Weight Scale for long-term tracking
- Sources
Why monitoring long-term wellness trends at home actually works
Smart scales are directional tools, not clinical instruments. Weight readings are highly reliable. Body-composition estimates — body fat percentage, lean mass, visceral fat — are directional at best. That distinction matters for how you use the data.
The technology behind body-composition readings is called bioelectrical impedance analysis (BIA). A low-level electrical current passes through your body; the scale measures how fast it travels and estimates tissue composition from that speed. The problem is that dozens of variables affect conductivity: hydration, skin temperature, recent food, time of day. Healthline's review of body fat scale accuracy puts it plainly: consumer scales are reasonable for weight but less reliable for body composition, and they work best when used for trend monitoring between professional assessments.
What makes BIA useful despite those limits is consistency. When you measure under identical conditions every time, the device compares itself against itself. Random daily noise cancels out over weeks. The trend that emerges is real.
The main disruptors to watch for:
- Hydration: A roughly 2% shift in body water can move body-fat readings by about 2–3 percentage points — the single biggest source of BIA variance
- Time of day: Morning readings are consistently lower and more stable than evening ones
- Recent exercise: Hard training inflames tissue and temporarily shifts fluid distribution
- Surface: Carpet compresses unevenly and introduces error
- Skin temperature: Cold extremities raise impedance artificially
For clinical decisions — diagnosing obesity, tracking disease-related muscle loss — a DEXA scan is the reference standard. For home wellness tracking over months, a well-used smart scale is more than adequate.
What your smart scale actually measures
Consumer scales typically report seven metrics. Some are solid; others are calculated guesses.
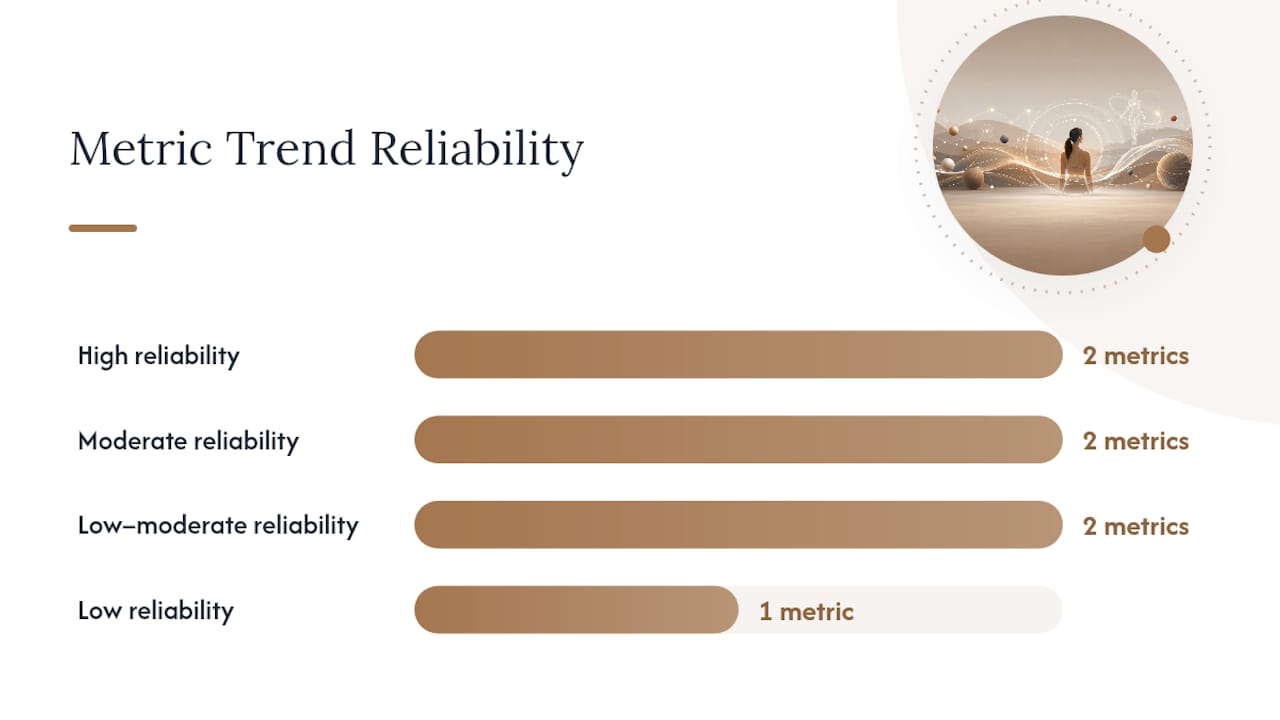
| Metric | What it measures | Trend reliability | Key limitation |
|---|---|---|---|
| Weight | Total body mass | High | Fluctuates 2–5 lbs daily from fluid |
| Body fat % | Estimated fat as share of total mass | Moderate (directional) | Can be off by 3–8 points vs DEXA |
| Lean/muscle mass | Estimated non-fat tissue | Moderate | Sensitive to hydration and timing |
| Body water % | Estimated total body fluid | Low–moderate | Highly variable; reflects hydration state |
| Visceral fat | Estimated deep abdominal fat level | Low–moderate | Algorithm-derived; treat as a rough signal |
| Bone mass | Estimated skeletal mass | Low | Rarely changes meaningfully short-term |
| BMI | Weight divided by height squared | High (math) | Ignores body composition entirely |
The three metrics worth tracking closely over months are weight trend, body fat % trend, and lean mass trend. Bone mass and protein percentage are often calculated from other estimates and add little signal for most people.
Reviews consistently note that individual body-fat readings can be off by 3–8 percentage points compared to clinical methods. Treat your body-fat percentage as a relative unit — what matters is whether it moves up or down over time, not the absolute number on any given Tuesday.
One more caveat: if you're a trained athlete with unusually high muscle density, standard BIA algorithms tend to overestimate body fat. Many scales include an "athlete mode" that adjusts the algorithm. Use it if it applies to you.
How to take measurements that actually produce useful data
The protocol is simple: same time, same conditions, same device, every time. Rolling averages and consistent morning protocols transform noisy daily numbers into reliable trend data — the research on this is consistent.
- Choose a fixed time. Morning, immediately after using the bathroom, is the gold standard. Circadian hydration patterns make evening readings systematically higher and more variable.
- Empty your bladder first. Urine weight is real weight, and it varies.
- Go barefoot, feet warm. Cold skin increases impedance artificially.
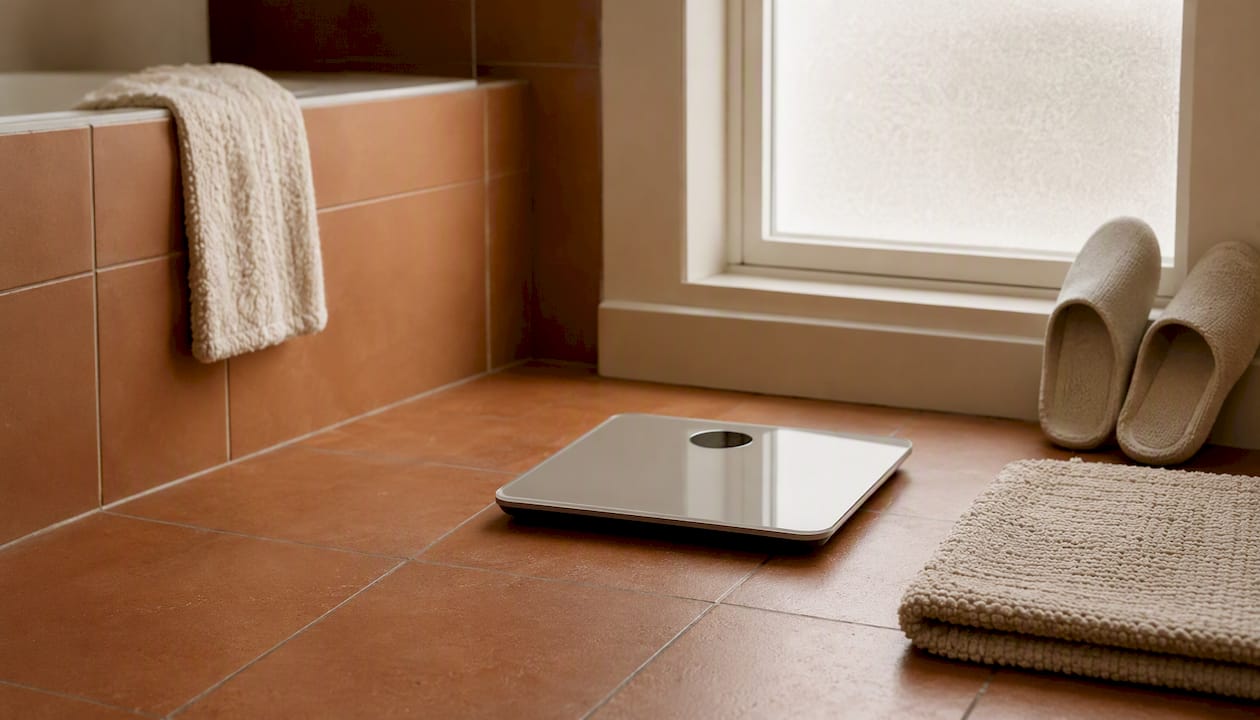
- Use a hard, flat surface. Tile or hardwood, not carpet or a bath mat.
- Log to the same profile. If your scale supports multiple users, always select your own profile. Cross-user data contamination is a common and easily avoided error.
- Minimal clothing. Or none — consistency matters more than the exact choice.
- Avoid alcohol or intense training the night before when you want a clean baseline reading.
Weekly vs. daily cadence: Daily logging gives you more data points but also more noise to manage emotionally. A weekly weigh-in on the same morning reduces anxiety and still produces a clear trend when viewed across 6–8 weeks. For most people, weekly is the better default.
Pro Tip: Place the scale in the same spot on the floor every time. Slight surface variations between locations change readings. Mark the spot with a small piece of tape if you need to.
For households with multiple users, the guide on how scales handle multiple user profiles covers setup in detail.
How to read your data over months
Single readings are noise. Trends are signal. The rule for home wellness analytics: look at 3–6 month windows, not individual days.
Practical smoothing approaches:
- 7-day rolling average: Good for catching week-to-week shifts; smooths out one-off spikes from a salty meal or a hard workout
- 30-day rolling average: Better for seeing the true direction of a body-composition change
- Monthly snapshot: Pick one reading per month (same day, same conditions) and compare those 12 data points across a year
What different patterns typically mean:
- Weight dropping, lean mass stable: Fat loss is likely happening. This is the pattern most people are working toward.
- Weight dropping, lean mass also dropping: The caloric deficit may be too aggressive, or protein intake is low. Worth adjusting before the trend continues.
- Weight stable, body fat % slowly declining: Body recomposition — losing fat while building or maintaining muscle. Common in people who lift regularly.
- Sudden spike (2–4 lbs overnight): Almost always water retention from sodium, carbohydrates, or inflammation. Not fat gain.
A change worth paying attention to is a sustained directional shift over 4–8 weeks, not a single reading. Document contextual events — illness, travel, a diet change, a new training block — in a notes column alongside your data. That context explains most "mysterious" trend shifts.
Visualizing the data helps. Most scale apps include a trend line view. A simple spreadsheet with a line graph works just as well and gives you full control over your data.
What to track alongside your scale
Scale data alone gives you an incomplete picture. Combining scale trends with waist circumference, strength logs, and progress photos produces a far more reliable read on body recomposition than any single metric.
- Waist circumference: Measure at the narrowest point, or at the navel, with a flexible tape. Same time of day, relaxed exhale. This catches visceral fat changes the scale's algorithm can miss.
- Strength and performance logs: Track a few key lifts or a cardio benchmark. If your scale says you're losing lean mass but your squat is going up, the scale is probably wrong.
- Progress photos: Front, side, and back, same lighting, same time of day, every 4 weeks. Visual change often precedes scale change by weeks.
- Clothing fit: Belt notch and how a specific pair of pants fits are surprisingly reliable signals, especially during body recomposition when weight barely moves.
For deeper validation, a DEXA scan every 6–12 months gives you a clinical baseline to compare against your home trend data. Lab work (metabolic panel, lipids) adds context that no scale can provide.
Why readings sometimes jump — and how to fix it
Most sudden jumps have a simple cause. Run through this checklist before concluding anything is wrong with your body or your device.
- Wet or cold feet: Dry and warm them before stepping on. Moisture on the electrodes changes conductivity directly.
- Carpet or uneven surface: Move to a hard floor.
- Low battery: Replace it. Weak battery voltage affects sensor output on many models.
- Wrong user profile selected: Check the app before logging the reading.
- Recent intense exercise: Muscle inflammation temporarily shifts fluid. Wait 12–24 hours for a cleaner reading.
- Alcohol the night before: Dehydrates tissue and skews BIA results significantly.
- Inconsistent placement: Put the scale back in its marked spot.
Pro Tip: Once a month, step on a calibrated scale at a gym or clinic and compare the weight reading to your home scale. Weight should match within 0.5 lbs. If it doesn't, your scale may need recalibration or replacement. Body-composition estimates don't need to match — they use different algorithms — but weight should.
What happens to your data in the cloud
Most smart scale apps sync biometric data to a cloud server automatically. That data often includes weight, body-fat estimates, and trend history — and depending on the app's privacy policy, it may be shared with third parties or used for product improvement.
Practical steps to protect your data:
- Review app permissions before granting access to contacts, location, or other health apps
- Read the privacy policy for data retention periods and third-party sharing practices
- Opt out of cloud backup if the app offers a local-only mode and you prefer it
- Use a strong, unique password for your scale app account
- Enable two-factor authentication if the app supports it
To share trend data with a clinician, export a 3–6 month summary from the app (most support CSV or PDF export) and highlight the trend line, not individual readings. A one-page graph showing weight and body-fat % over time is far more useful to a provider than a raw data dump.
When to call your doctor or dietitian
Most scale fluctuations are normal. A few patterns warrant a professional conversation.
Red flags to bring to a healthcare provider:
- Unexplained weight loss of more than 5% of body weight over 6–12 months without a deliberate dietary change
- A persistent downward trend in lean mass over 8+ weeks, especially without a change in training or diet
- Rapid weight gain (several pounds per week) with no obvious dietary cause
- Any metric change accompanied by symptoms: fatigue, dizziness, unusual thirst, or shortness of breath
When you go, bring a printed or exported trend graph covering the past 3–6 months. Note any lifestyle changes, illnesses, or medication changes alongside the data. That context helps a clinician interpret the numbers accurately.
Houston Methodist's guidance is worth bookmarking: smart scales are monitoring tools, and a healthcare provider should interpret significant or unexplained shifts in the context of your full medical picture. This article is general information, not a substitute for professional medical advice.
The routine that actually sticks
The tracking routines that hold up over months share one quality: they're boring. Step on the scale every Monday morning, log the number, glance at the 30-day trend line, and move on with your day. Add a waist measurement once a month and a progress photo every four weeks. Check your strength benchmarks every 6–8 weeks.
That's it. The 3–6 month view is where the real information lives, and you can't see it if you're reacting to every daily reading. Combining the scale trend with waist and strength data gives you three independent signals pointing in the same direction — or flagging a contradiction worth investigating. The scale is one input, not the verdict.
The Uvirello Smart Electronic Weight Scale for long-term tracking
Consistent home health monitoring starts with a scale you can trust to give the same reading under the same conditions, week after week. The Uvirello Smart Electronic Weight Scale is built for exactly that kind of long-term trend work.
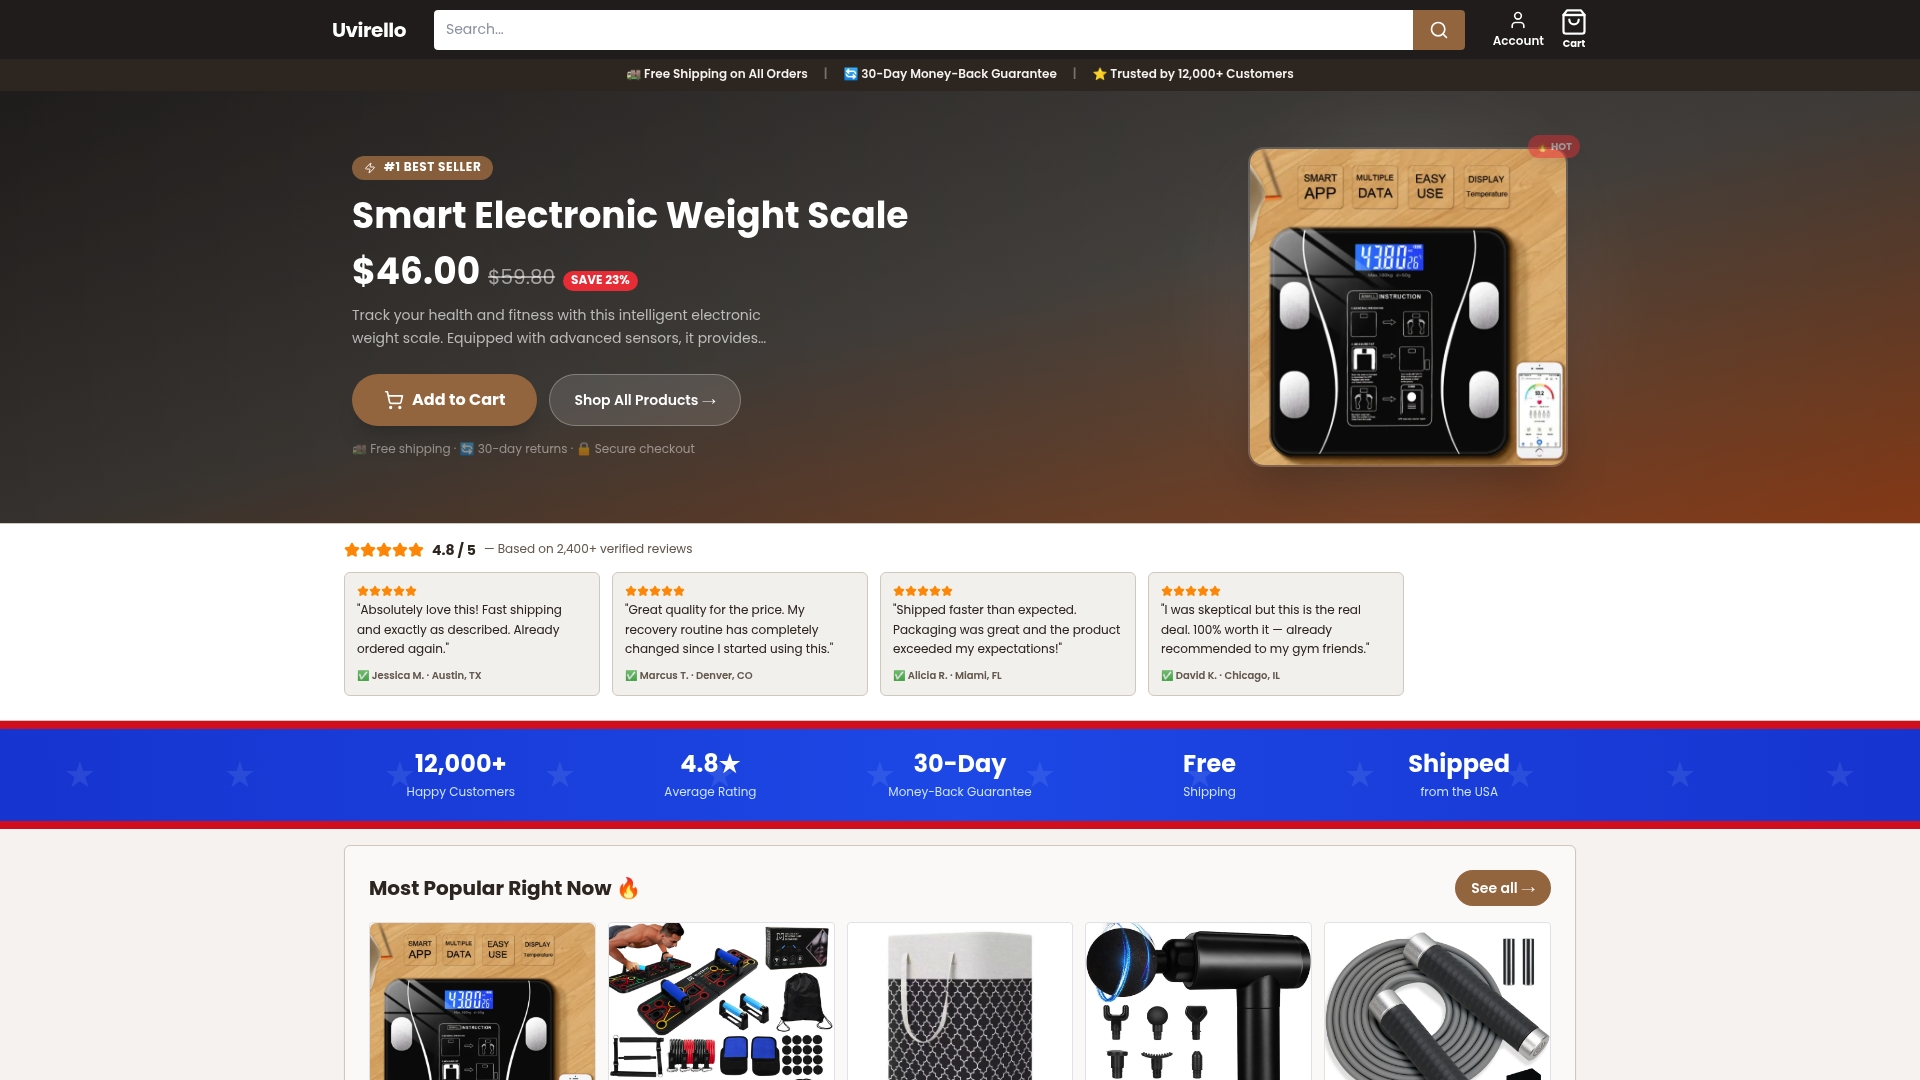
High-precision load cells deliver reliable weight readings, and the BIA algorithm applies consistently across sessions so your trend data stays comparable over months. Multi-user profiles keep household members' data cleanly separated, and the app's trend view lets you see 30-day and 90-day lines without building a spreadsheet. Trusted by over 12,000 customers with a 4.8/5 average rating, it's a scale that earns its place in a serious home monitoring routine.
Ready to start building a real trend baseline? Order the Uvirello scale and take your first controlled morning reading this week.
Sources
- Are body composition scales accurate? | Houston Methodist
- Body fat scale accuracy: Are body fat scales accurate? | Healthline
- How Do Smart Scales Work? BIA Accuracy Explained (2026)
- Athletedata