
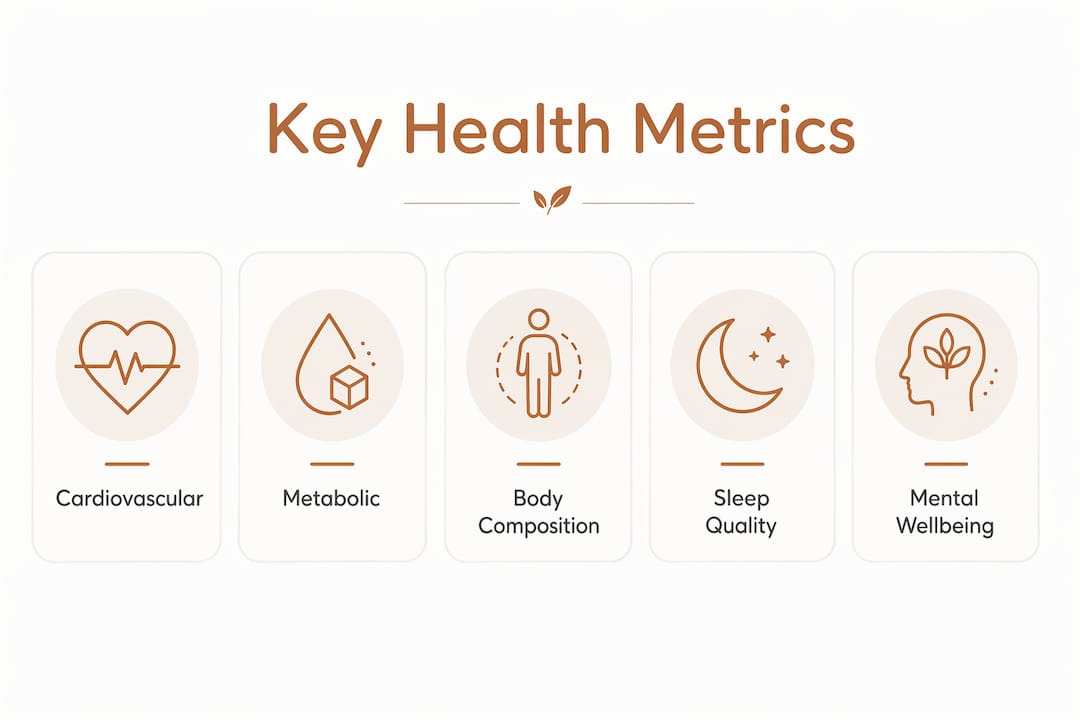
The most impactful health metrics to track are blood pressure, resting heart rate, fasting blood glucose, cholesterol (LDL and HDL), body composition, sleep quality, and waist circumference. These are not just numbers on a chart. They are early warning signals for cardiovascular disease, metabolic disorders, and other conditions that develop silently over years. Choosing health metrics worth tracking means focusing on measures that are clinically meaningful, modifiable with lifestyle changes, and actionable enough to guide real decisions.
Here is a quick-reference list of the core metrics every adult in the US should know:
- Blood pressure — the single most important cardiovascular risk indicator
- Resting heart rate — reflects cardiovascular efficiency and recovery capacity
- LDL and HDL cholesterol — key markers for arterial health and heart disease risk
- Fasting blood glucose — detects insulin resistance and prediabetes early
- Body composition — body fat percentage and muscle mass, not just weight
- Waist circumference — a direct proxy for visceral fat and metabolic risk
- Sleep quality and duration — affects hormones, immunity, and cognitive function
- Heart rate variability (HRV) — a leading indicator of stress and recovery
- VO2 max — the strongest single predictor of long-term cardiovascular health
- Hydration and nutrition quality — foundational but often overlooked
- Mental health indicators — stress levels and mood trends over time
What do the most important health indicators actually measure?
Each metric on that list earns its place for a specific reason. Understanding what it measures and why it matters helps you decide which ones deserve your attention first.
Blood pressure and resting heart rate
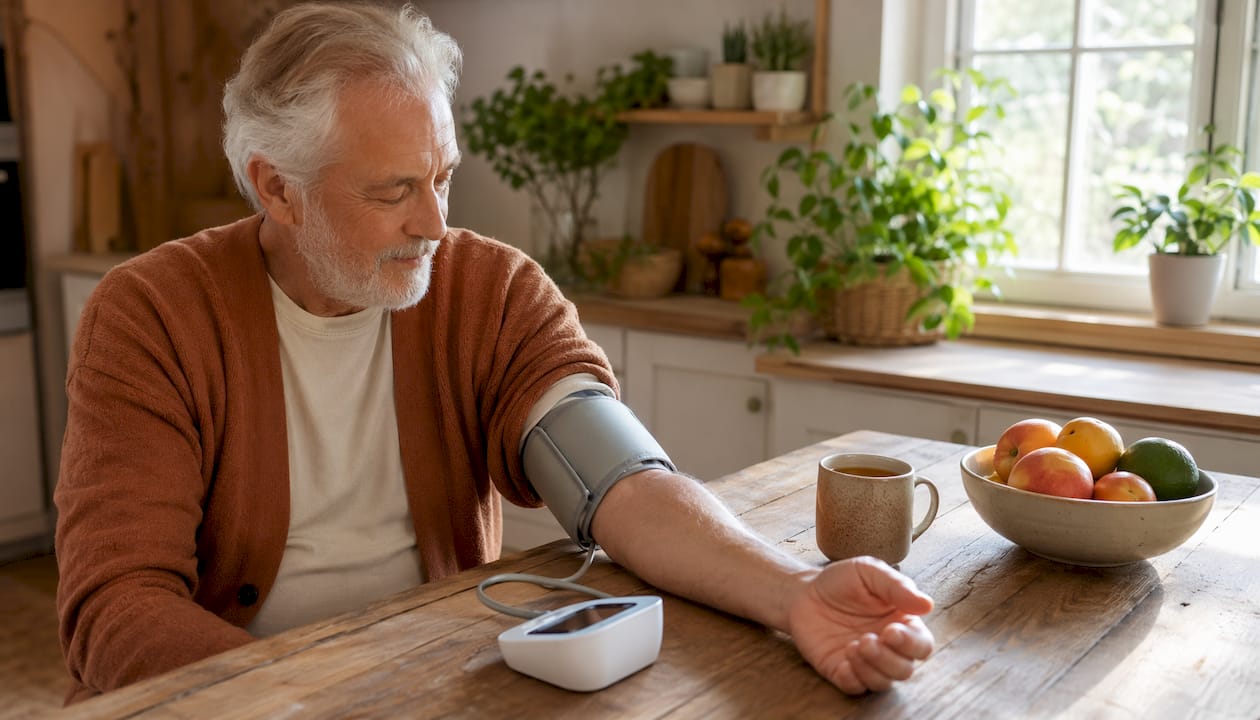
Blood pressure above 130/80 mmHg is classified as hypertension by American Heart Association guidelines, and most people have no symptoms until organ damage has already begun. Resting heart rate tells a different story: a lower resting rate generally reflects a stronger, more efficient heart. Tracking both together gives you a real-time picture of cardiovascular load.
Cholesterol and blood sugar
LDL cholesterol drives plaque buildup in arteries. HDL cholesterol helps clear it. Experts recommend tracking both as part of a full lipid panel, not just total cholesterol, because the ratio matters as much as either number alone. Fasting blood glucose and HbA1c (a three-month blood sugar average) catch insulin resistance years before a type 2 diabetes diagnosis arrives.
Body composition and waist circumference
Weight alone is a poor health indicator. Two people at the same weight can have vastly different health profiles depending on their ratio of fat to muscle. Body fat percentage and muscle mass, measured by a smart electronic weight scale with bioelectrical impedance, give you the breakdown that a standard bathroom scale cannot. Waist circumference above 35 inches for women and 40 inches for men is associated with elevated metabolic and cardiovascular risk, making it one of the most clinically useful measurements you can take at home.
Sleep quality, HRV, and VO2 max
Sleep is where recovery happens. Poor sleep quality, not just short duration, disrupts cortisol regulation, appetite hormones, and immune function. HRV, or heart rate variability, measures the variation in time between heartbeats and serves as a leading indicator of how well your nervous system is recovering from stress. VO2 max, your body's maximum oxygen uptake during exercise, is strongly linked to longevity and is now measurable through consumer wearables with reasonable accuracy. You can explore fitness metrics beyond weight for a deeper look at these performance-based indicators.
Mental health, hydration, and nutrition
Mood tracking and perceived stress scores are not soft metrics. Chronic psychological stress elevates cortisol, raises blood pressure, and disrupts sleep, creating a cascade that shows up in your other numbers. Hydration and diet quality are harder to quantify precisely, but tracking water intake and macro patterns over weeks reveals habits that drive or undermine every other metric you follow.
Pro Tip: For older adults, add vitamin D levels to your annual panel. Deficiency is common, often asymptomatic, and linked to bone density loss, immune suppression, and mood disorders. A simple blood test catches it before it compounds.
How do you choose health metrics worth tracking for your situation?
The most common mistake is tracking what is easy to measure rather than what actually matters. Step counts are a good example: they measure movement behavior, but they do not tell you whether your cardiovascular system is improving, whether you are recovering from stress, or whether your metabolic health is trending in the right direction.
Healthy People 2030 offers a useful framework here. Its Leading Health Indicators prioritize upstream measures, meaning risk factors and behaviors that are modifiable in the short term, over static disease outcomes. That principle applies directly to personal tracking: choose metrics you can actually change with diet, exercise, sleep, or stress management.
A practical selection process looks like this:
- Start with your risk profile. Family history of heart disease? Prioritize blood pressure, LDL, and fasting glucose. Sedentary job? Add waist circumference and VO2 max.
- Distinguish leading from lagging indicators. Leading indicators like HRV and sleep efficiency warn you before symptoms appear. Lagging indicators like HbA1c confirm what has already happened. You need both, but leading indicators give you more time to act.
- Limit your active tracking list to 4–6 metrics. More than that creates noise and decision fatigue. Pick the ones most relevant to your current health goals and revisit the list quarterly.
- Avoid vanity metrics. Daily step counts, calorie burn estimates from wearables, and raw weight fluctuations are all noisy signals that rarely drive meaningful behavior change on their own.
- Track trends, not single readings. One elevated blood pressure reading after a stressful morning means nothing. A pattern of elevated readings across three months means something. Focus on tracking trends rather than reacting to individual data points.
- Align metrics with modifiable behaviors. If you cannot change anything based on a reading, that metric probably does not belong in your core tracking list.
Quarterly reviews work better than daily monitoring for most metrics. Daily data creates anxiety around normal fluctuations. A three-month rolling view reveals genuine trends and supports the kind of lifestyle adjustments that actually move numbers.
What do physicians and clinical researchers say about tracking health data?
The clinical consensus is clear: more data is not better data. The goal of tracking is early identification of cardiovascular and metabolic risk, not the accumulation of health statistics.
That perspective cuts against the trend toward full-body scans, continuous glucose monitors for people without diabetes, and detailed wearable dashboards that generate hundreds of data points daily. Experts warn against over-optimization from wearables and consistently return to foundational metrics: blood pressure, a full lipid panel, blood glucose, and body composition. These are the numbers that predict disease decades in advance and respond to lifestyle intervention.
Clinical guidelines reinforce this. Blood pressure, LDL cholesterol, fasting blood glucose, and waist circumference appear across major American health frameworks as the core metrics for cardiovascular and metabolic risk assessment. Longevity-focused clinicians add VO2 max, grip strength, HRV, and biological age markers for a more complete picture, particularly for adults over 40.
The Uvirello Smart Electronic Weight Scale fits directly into this clinical framework. With over 12,000 verified customer reviews and an average rating of 4.8 out of 5, it delivers body fat percentage, muscle mass, BMI, and other body composition metrics that a standard scale cannot provide. Body composition is one of the metrics physicians most want patients to monitor at home, and having accurate, consistent readings over time is what makes the data clinically useful.
Which tools help you track key health metrics at home?
The right tools depend on which metrics you are prioritizing. Here is a practical breakdown of what works, and where the limits are.
- Smart electronic weight scale — measures body weight, body fat percentage, muscle mass, BMI, and sometimes bone density and visceral fat. The Uvirello Smart Electronic Weight Scale uses high-precision bioelectrical impedance sensors and connects to a companion app for trend tracking. It is one of the most accessible ways to monitor body composition consistently at home.
- Home blood pressure monitor — a validated upper-arm cuff (not a wrist device) is the standard for accurate home readings. Take readings at the same time each day, twice in a row, and log the average.
- Glucometer or continuous glucose monitor (CGM) — glucometers work well for periodic fasting glucose checks. CGMs provide continuous data and are particularly useful for people managing prediabetes or diabetes, though they require a prescription in most US states.
- Wearable fitness tracker or smartwatch — useful for resting heart rate, HRV, sleep staging, and estimated VO2 max. Calorie burn estimates from wearables are notoriously inaccurate, so treat those numbers as rough directional signals rather than precise data.
- Sleep tracking devices — dedicated sleep trackers or wearables with sleep-stage detection give you data on sleep duration, efficiency, and disturbances. For a deeper look at monitoring sleep quality, specialized sleep health tools offer more granular metrics than general-purpose wearables.
- Lab testing for cholesterol, glucose, and vitamin D — home monitoring cannot replace annual bloodwork. Cholesterol panels, HbA1c, and vitamin D levels require a blood draw and lab analysis. Many US primary care providers include these in annual wellness visits, and direct-to-consumer lab services make them accessible without a doctor's referral.
- Health tracking apps — apps like Apple Health, Google Fit, and dedicated platforms aggregate data from multiple devices and display trends over time. The aggregation function is where the real value lies: seeing blood pressure, sleep, and weight trends on one timeline reveals connections that individual readings hide.
Modern IoT-connected devices are making this easier. IoT-enabled health tracking now allows scales, blood pressure monitors, and wearables to sync automatically, reducing the friction of manual logging and making quarterly trend reviews far more practical.
Pro Tip: When choosing a smart scale, look for one that uses multi-frequency bioelectrical impedance and syncs with your phone's health app. Single-frequency devices are less accurate for body fat estimates, especially at higher or lower body fat percentages.
Why daily physical activity is a metric worth watching
Daily physical activity sits at the intersection of nearly every other metric on this list. Regular movement lowers resting heart rate, improves insulin sensitivity, raises VO2 max, reduces visceral fat, and improves sleep quality. It is one of the few behaviors that simultaneously moves multiple health indicators in the right direction.
The most useful way to track physical activity is not step count but exercise intensity and consistency. Tracking the number of moderate-to-vigorous activity sessions per week, combined with a measure of cardiovascular fitness like resting heart rate trend or estimated VO2 max, gives you a far clearer picture of whether your activity level is actually improving your health. Healthy People 2030 includes physical activity among its Leading Health Indicators precisely because it is upstream of so many disease outcomes and responds quickly to behavioral change.
Resistance training deserves specific attention here. Grip strength, a proxy for overall muscle strength, is one of the key longevity metrics that physicians now track alongside cardiovascular markers. Muscle mass declines with age, and tracking it through body composition measurements, combined with a consistent resistance training log, gives you early warning of sarcopenia before it affects mobility or metabolic rate.
Key Takeaways
Tracking 4–6 clinically meaningful health metrics and reviewing them quarterly gives you the clearest, most actionable picture of your long-term health trajectory.
| Point | Details |
|---|---|
| Prioritize clinical metrics | Blood pressure, LDL cholesterol, fasting glucose, and body composition predict disease risk decades in advance. |
| Lead with leading indicators | HRV, sleep quality, VO2 max, and grip strength warn you before symptoms appear, giving you time to act. |
| Limit your tracking list | Monitoring 4–6 core metrics reduces noise and keeps your focus on what you can actually change. |
| Review trends quarterly | Three-month rolling averages reveal genuine health patterns; single daily readings rarely do. |
| Combine home tools with lab tests | Smart scales and wearables cover body composition and heart rate, but cholesterol, glucose, and vitamin D require annual bloodwork. |