
A small daily shift in your body water percentage usually reflects normal hydration fluctuation or measurement noise. A sustained change over several days is more likely to signal a real shift in hydration status or body composition. Before you adjust your diet, training, or fluid intake based on a single reading, re-measure using the protocol in section 8.
Likely normal:
- A 0.5–1% swing between morning readings on consecutive days
- A drop right after intense exercise or a salty meal
- A slight rise after drinking a large glass of water
Possibly meaningful:
- A consistent 1–2% directional shift over 5–7 days with no obvious cause
- A reading that diverges noticeably from your established personal baseline
Seek help:
- Rapid unexplained fluid loss equivalent to several percent of body weight
- Visible swelling (edema), dizziness, confusion, or shortness of breath alongside a TBW% change
Key Takeaways
Tracking body water percentage changes is most useful as a trend metric: a single reading tells you almost nothing, but 10 consistent morning measurements reveal patterns worth acting on.
| Point | Details |
|---|---|
| Single readings are noise | A 0.5–1% daily swing is normal; only a sustained 1–2% directional shift over 5–7 days is meaningful. |
| 90-minute fluid rule | Avoid food and drink for at least 90 minutes before measuring to prevent false BIA readings. |
| Morning protocol wins | Measure after voiding, before eating, on a hard surface, at the same time daily to minimize error. |
| Combine metrics | Pair TBW% with body weight and body fat percentage to distinguish fat loss, muscle gain, and fluid retention. |
| Uvirello for trend tracking | The Uvirello Smart Electronic Weight Scale delivers consistent BIA readings designed for the daily baseline routine this article recommends. |
Table of Contents
- What does total body water percentage actually measure?
- What are healthy TBW% ranges by sex, age, and body type?
- How is TBW% measured, and where do smart scales fall short?
- What causes short-term TBW% changes within hours or days?
- What drives sustained TBW% changes over weeks or months?
- How do you read a TBW% change: what size actually matters?
- What is the most reliable protocol for measuring TBW% at home?
- When should a TBW% change prompt medical attention?
- What does the research actually say about BIA accuracy and trend tracking?
- Do ethnicity and genetics affect body water percentage?
- How do altitude and climate affect your hydration and TBW%?
- How to use TBW% alongside weight, BMI, and electrolyte data
- The number people obsess over is usually the wrong one
- The Uvirello Smart Scale gives you the trend data that actually matters
- Sources
What does total body water percentage actually measure?
Total body water percentage, abbreviated TBW%, is simply the ratio of your body's total water content (in liters) to your body weight (in kilograms), expressed as a percent. A person carrying approximately 60% of their body weight as water has a representative TBW% value. That single number captures fluid distributed across every cell, organ, blood vessel, and interstitial space in your body.
The metric matters more than the raw liter figure because body size varies so widely. Two people can both be well-hydrated while carrying very different absolute water volumes. TBW% normalizes for size and, more usefully, tracks relative change over time.
Three main approaches estimate TBW% in practice. Bioelectrical impedance analysis (BIA), the technology inside most body composition metrics smart scales, passes a low-level electrical current through the body and infers water content from the resistance it encounters. Lean tissue conducts electricity well; fat tissue does not. Isotope dilution techniques, using tracers like deuterium (²H) or oxygen-18 (¹⁸O), are the gold standard in research labs but require specialized equipment and days of testing. Formula-based estimates, such as the Watson equation, use height, weight, age, and sex to predict TBW without any device.
For home tracking, BIA is the practical choice. Its absolute accuracy has limits, but its ability to detect directional trends is well-supported by research.
What are healthy TBW% ranges by sex, age, and body type?
Reference ranges vary more than most people expect, and that variability is the point. A large BIA study of 545 participants aged 3–98 found adult averages generally fall within defined ranges for men and women, with declines often observed with increasing age. The USGS and major health references report a similar adult range of roughly 55–65% for men and 50–60% for women, with infants sitting considerably higher.
Why the sex gap? Muscle holds roughly three times more water per unit mass than fat. Men typically carry more lean mass relative to total weight, so their TBW% runs higher. Women's naturally higher average body fat percentage pulls the number down.
Key reference points:
- Infants: TBW% can exceed 75%, reflecting the high water content of developing tissue
- Adult men (18–60): roughly 55–65%, depending on lean mass and fitness level
- Adult women (18–60): roughly 50–60%, with the lower end common in higher body-fat ranges
- Adults over 60: expect a gradual decline as lean mass decreases with age
- Overweight individuals: tend to show lower TBW% for their weight because fat mass dilutes the proportion
The Healthline body water reference guide compiles practical ranges by age and sex and notes that the Watson formula can give a rough estimate from basic measurements alone.
One practical implication: your personal baseline, tracked consistently over weeks, tells you far more than where you fall on a population chart. A lean, muscular person at 63% and a sedentary person at 53% can both be perfectly healthy.
How is TBW% measured, and where do smart scales fall short?
BIA works by sending a weak electrical current, typically in the microamp range, through the body via electrodes on the scale's surface. The device measures the impedance (resistance plus reactance) and uses a built-in algorithm to estimate lean mass, fat mass, and water content. Because water and electrolytes conduct electricity and fat does not, the ratio of impedance values maps roughly onto the ratio of lean to fat tissue.
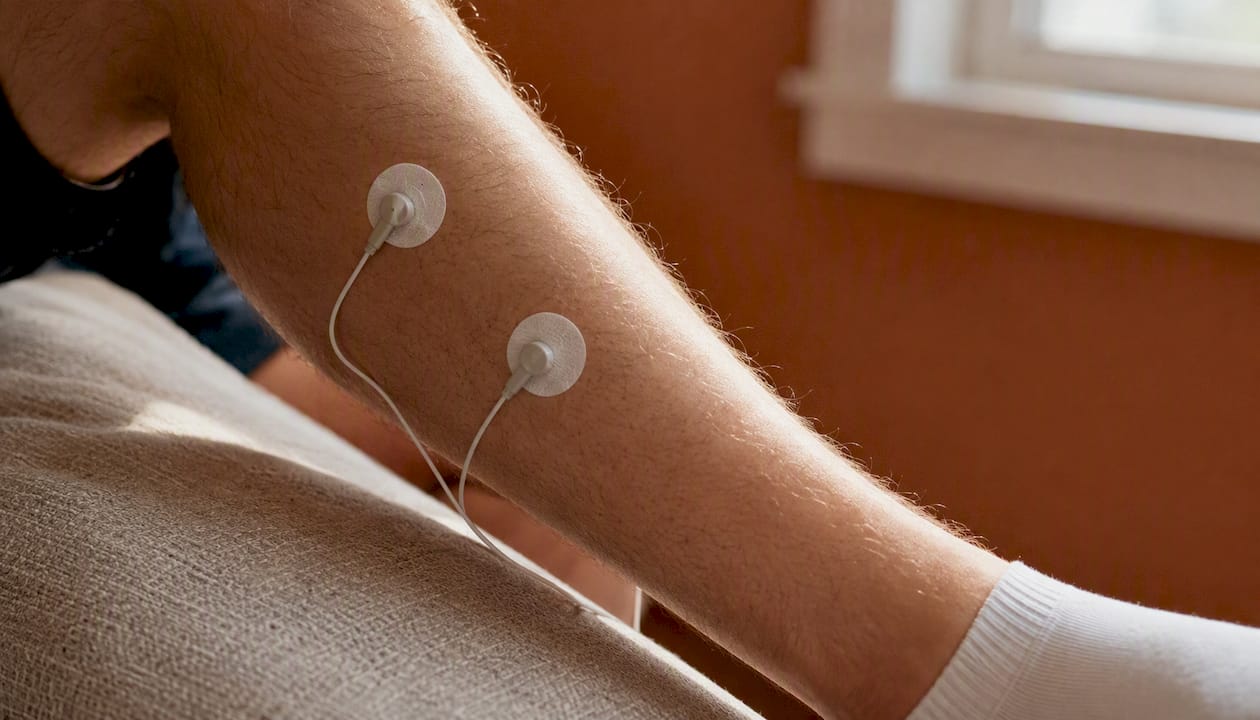
Gold-standard isotope dilution methods are far more precise. A participant drinks a measured dose of labeled water, waits for it to equilibrate across body compartments, and then provides a urine or blood sample for mass spectrometry analysis. The result is an accurate absolute TBW volume. The process takes 4–6 hours minimum and requires a clinical lab. No home device replicates it.
A controlled study comparing BIA to dilution methods found that BIA estimates of total body water closely correlate with reference dilution methods when fluid shifts are equilibrated, but BIA is less reliable for assessing fat mass and fat-free mass during acute hydration changes. That distinction matters practically: measure right after drinking a liter of water and your reading is compromised.
The table below maps the most common error sources to their likely effect on your reading.
| Error source | Likely effect on TBW% reading |
|---|---|
| Drinking 600 mL within 30–90 minutes of measurement | Significant short-term changes in TBW% (statistically significant fluctuations observed in BIA study; fluid restriction of at least 90 minutes recommended pre-measurement) |
| Intense exercise within 2–3 hours | Temporarily depressed TBW% due to sweat loss |
| Large meal within 2 hours | Elevated reading from gut fluid and food weight |
| Alcohol consumption the night before | Depressed TBW% from diuretic effect |
| Cold skin or extremities | Elevated impedance, underestimates TBW% |
| Inconsistent electrode contact (dry feet, poor placement) | Erratic, unreliable readings |
Pro Tip: Measure first thing in the morning, after using the restroom and before eating or drinking anything. That single habit eliminates most of the error sources in the table above.
A 2025 scoping review in JMIR mHealth confirmed that BIA-based smart scales are the leading noninvasive home technology for hydration monitoring, with the strongest evidence supporting their use for tracking trends rather than pinpointing exact hydration volume.
What causes short-term TBW% changes within hours or days?
Most of the dramatic swings people see on a smart scale from one day to the next have nothing to do with true hydration status. They reflect predictable, transient fluid shifts that the body's own regulatory systems drive constantly. Physiological fluid regulation through vasopressin and kidney function redistributes water between intracellular and extracellular compartments throughout the day, so minor fluctuations are built into normal biology.
Here are the most common short-term drivers:
- Drinking water or isotonic drinks: A controlled BIA study (n=95) found that drinking 600 mL of an isotonic drink produced significant short-term increases in body mass and visceral fat readings and produced statistically significant changes in body-water percentage within 30–90 minutes; the authors recommend fluid restriction at least 90 minutes before BIA measurements to avoid false values.
- Sodium-rich meals: Salt pulls water into the extracellular space. A high-sodium dinner can raise scale weight by 1–2 lbs overnight and temporarily inflate TBW% readings the next morning.
- Carbohydrate intake and glycogen: Each gram of glycogen stored in muscle binds roughly 3 grams of water. A high-carb day after a depletion phase can raise TBW% noticeably within 24 hours, even without extra fluid intake.
- Alcohol: A diuretic effect suppresses vasopressin, increasing urine output. A night of drinking typically depresses TBW% readings the following morning.
- Exercise and sweat: Hard training can drop TBW% acutely through sweat loss, then push it back up as you rehydrate over the following hours. Post-exercise readings are among the least reliable you can take.
- Menstrual cycle: Estrogen and progesterone fluctuations drive fluid retention in the luteal phase (roughly days 14–28). TBW% can rise 1–2% in the week before menstruation and normalize quickly after it begins.
For anyone tracking hydration and cognitive performance, these short-term swings are worth understanding because they can mask the signal you actually care about.
What drives sustained TBW% changes over weeks or months?
When a directional shift in TBW% holds for two weeks or more, the cause is almost always a real change in body composition or a medical condition rather than measurement noise.
Muscle gain is the most common positive driver. Skeletal muscle is roughly 73–75% water by weight. As you add lean mass through resistance training, your body's total water content rises proportionally, and TBW% climbs with it. This is one reason tracking body composition beats tracking weight alone: a rising TBW% alongside stable or increasing body weight is a strong signal of muscle gain, not fat gain.
Fat gain works in the opposite direction. Fat tissue is roughly 10–15% water. As body fat percentage rises, the water-rich lean tissue makes up a smaller share of total mass, and TBW% falls even if absolute water volume stays the same.
Aging produces a gradual, unavoidable decline. The same BIA study of 545 participants that established adult reference ranges found consistent TBW% declines after age 60, driven primarily by loss of lean mass. This has real clinical relevance: older adults with low TBW% are more vulnerable to dehydration and its downstream effects on kidney function and cognition.
Chronic fluid retention is a different mechanism entirely. Conditions like heart failure, kidney disease, and liver cirrhosis impair the body's ability to excrete fluid, causing water to accumulate in interstitial spaces. TBW% may read elevated while the person is functionally fluid-overloaded. Certain medications, including corticosteroids, NSAIDs, and some antihypertensives, can produce similar effects. A rising TBW% trend combined with visible swelling or unexplained weight gain warrants medical evaluation, not a dietary tweak.
How do you read a TBW% change: what size actually matters?
Single readings are almost never worth acting on. The signal lives in the trend.
A practical way to think about thresholds: a 0.5% shift on a single morning, with no change the following day, is almost certainly measurement noise or a minor hydration event. A 1–2% directional move that persists across 5–7 consecutive measurements, taken under consistent conditions, is more likely to reflect a real change in hydration or composition.
Consider two scenarios. You ate a salty restaurant meal last night and your TBW% reads 1% lower than yesterday. That is a textbook short-term sodium-driven fluid shift. Re-measure tomorrow morning under standard conditions and it will likely normalize. Compare that to a steady downward drift of 1.5% over 10 days during a caloric deficit. That pattern, especially if accompanied by a drop in body weight, suggests genuine fat loss with a corresponding reduction in total water mass.
The decision rule is straightforward. First, re-measure under the protocol in the next section. If the reading persists, cross-reference it against your body weight and any subjective symptoms. A change that shows up in both TBW% and weight, with no obvious short-term cause, is worth noting. If red flags like dizziness, swelling, or rapid weight change accompany it, escalate to clinical testing rather than self-managing.
Statistic callout: A wearable arm bioimpedance study reported Pearson r values ranging from 0.899 to 0.992 (mean ≈ 0.956) between arm bio-Z signals and percent body-weight loss during controlled dehydration, supporting the idea that well-placed bioimpedance reliably tracks relative hydration changes even when absolute values carry uncertainty.
What is the most reliable protocol for measuring TBW% at home?
Consistency is the entire game. The same device, the same time, the same conditions, every time. Here is a step-by-step protocol that mirrors the conditions used in the research studies cited throughout this article.
- Time of day: Measure first thing in the morning, ideally between 6:00 and 8:00 AM, before any food, drink, or significant activity.
- Void first: Use the restroom before stepping on the scale. Bladder and bowel contents affect both weight and impedance readings.
- No food or drink: Do not eat or drink anything for at least 90 minutes before measurement. The SMF-BIA study found that even 600 mL of fluid produced statistically significant BIA changes within 30 minutes.
- Minimal clothing: Bare feet on the electrodes, no socks. Consistent clothing (or none) removes weight variability.
- Same surface: Place the scale on a hard, flat floor every time. Carpet compresses unevenly and introduces error.
- Stand still: Distribute weight evenly, arms at your sides, and hold still for the full measurement cycle.
- Log the reading immediately: Record TBW%, body weight, and any relevant notes (poor sleep, late meal, travel) in a spreadsheet or health app.
Build a 7–14 day baseline before drawing any conclusions. With 10 or more consistent readings, you can calculate a simple rolling average that smooths out daily noise and reveals the actual trend.
Pro Tip: If you travel or miss your morning window, skip the measurement rather than take it under compromised conditions. One missing data point is far less damaging to your trend line than a bad reading that skews your average. For travel-specific tips, the travel-friendly fitness tracking guide covers how to maintain consistency on the road.
For anyone who fasts intermittently, hydration strategies during fasting can affect both your actual TBW% and the reliability of your morning reading, so it is worth understanding how your fasting window interacts with measurement timing.
When should a TBW% change prompt medical attention?
Most TBW% changes you will ever see are benign. A few patterns are not.
Red flags that warrant prompt medical evaluation:
- Rapid fluid loss equivalent to 2–5% of body weight over 24–48 hours, especially without an obvious cause like intense exercise in heat
- A persistent, unexplained rise in TBW% accompanied by visible swelling in the legs, ankles, or abdomen
- Symptoms alongside any TBW% change: dizziness, fainting, confusion, rapid heart rate, or shortness of breath
- A TBW% trend that continues moving in one direction for more than two weeks despite no change in diet, training, or fluid intake
If any of these apply, the next step is not another scale reading. Document your symptoms, note any medications you take (especially diuretics, corticosteroids, or NSAIDs), and contact your clinician. For severe symptoms, seek urgent care.
Clinicians investigating abnormal fluid balance typically order plasma osmolality and a basic metabolic panel (sodium, potassium, creatinine, BUN) as first-line tests. Imaging may follow if organ-related fluid retention is suspected. Public health guidance on fluid retention and edema outlines when self-care is appropriate and when medical review is necessary.
What does the research actually say about BIA accuracy and trend tracking?
The evidence base for home BIA is more nuanced than most product marketing suggests, and understanding it helps you use the technology correctly.
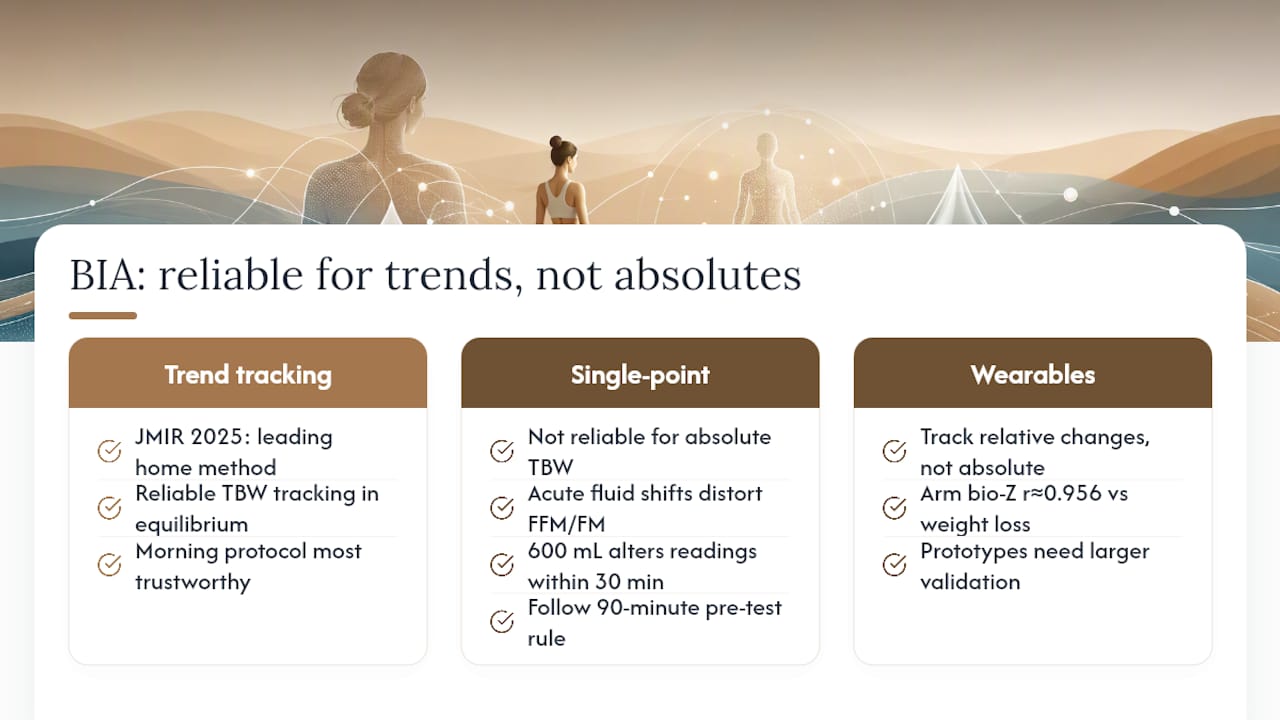
The 2025 JMIR mHealth scoping review is the most current synthesis available. It concluded that BIA-based smart scales are the leading noninvasive home technology for hydration monitoring, with the strongest evidence supporting trend tracking over single-point absolute measurements. That framing should anchor how you use any smart scale.
The controlled BIA vs. dilution study established that BIA tracks TBW well when the body is in equilibrium, but loses validity for fat mass and fat-free mass assessment during acute fluid shifts. The practical implication: your scale's TBW% reading is most trustworthy when you have been in a stable hydration state for several hours, which is exactly what the morning protocol achieves.
The SMF-BIA fluid consumption study (n=95) quantified the problem precisely. Drinking 600 mL produced significant changes in body-composition readings within 30 minutes, with TBW% fluctuating across the 90-minute observation window. The 90-minute pre-test fluid restriction rule comes directly from this finding.
On the wearable frontier, a sensors review described promising approaches including sweat-analysis patches, microwave dielectric sensors, and optical wristbands, but noted that most prototypes currently track relative changes rather than absolute TBW and need larger validation studies before clinical use. The arm bioimpedance wearable study showed mean Pearson r ≈ 0.956 between arm bio-Z and percent body-weight loss, which is a strong correlation for relative tracking but does not resolve the absolute-accuracy question.
Key takeaway from the evidence: BIA is a reliable relative tracker. Use it to detect directional trends, not to confirm you are at exactly 58.3% hydration.
Do ethnicity and genetics affect body water percentage?
They do, and the effect is large enough to matter when you interpret your readings against population charts.
Body composition research has consistently found differences in lean mass distribution, bone density, and fat patterning across ethnic groups. Because TBW% is tightly coupled to lean mass, these differences translate directly into different typical TBW% values. African American adults tend to have higher lean mass and bone density relative to body weight compared to white adults of the same BMI, which generally corresponds to higher TBW% at a given weight. Asian adults, particularly East Asian populations, often show higher body fat percentages at lower BMI values, which can push TBW% lower than population-average charts suggest.
Genetic factors compound this. Variants in genes governing muscle fiber type, fat distribution, and fluid-regulating hormones like aldosterone and vasopressin all influence where an individual's TBW% naturally sits. This is one reason practitioners treat personal baseline as more informative than population charts: your "normal" is your own repeated measurement under consistent conditions, not a number from a reference table built on a different demographic.
The practical implication for home tracking is simple. Do not anchor your interpretation to a published range if your ethnicity or body type differs from the population that range was built on. Track your own trend, and use the reference ranges as a rough orientation, not a target.
How do altitude and climate affect your hydration and TBW%?
Environmental conditions are among the most underappreciated drivers of TBW% change, and they can produce readings that look alarming if you do not account for them.
At altitude, the body responds to lower oxygen partial pressure by increasing ventilation rate and urine output, both of which accelerate fluid loss. Acute mountain sickness aside, even moderate altitude (above roughly 8,000 feet) can reduce TBW% measurably within 24–48 hours of arrival. Athletes who travel to high-altitude training camps often see a temporary drop in TBW% readings in the first few days before the body acclimatizes and plasma volume expands.
Hot, humid climates drive fluid loss through sweat even at rest. A person who relocates from a temperate climate to a hot one in summer may see TBW% readings drop by 1–2% in the first week until they adapt their fluid intake. Cold, dry environments have the opposite effect on sweat but increase respiratory water loss, which is less visible but still real.
The measurement protocol implication is straightforward: if your environment changes significantly (travel, season shift, altitude), expect your TBW% readings to shift temporarily and do not treat that shift as a body-composition change. Give yourself 5–7 days to acclimatize and re-establish a local baseline before drawing conclusions.
How to use TBW% alongside weight, BMI, and electrolyte data
TBW% read in isolation is a limited signal. Combined with two or three other metrics, it becomes genuinely useful for understanding what is happening in your body.
Body weight + TBW% is the most powerful pairing for home users. If weight drops and TBW% drops proportionally, you are likely losing fat and water together, common in a caloric deficit. If weight drops but TBW% rises, lean mass is likely being preserved while fat is lost, a favorable body-composition change. If weight rises and TBW% rises sharply over a short period, fluid retention is the more likely explanation than muscle gain.
BMI adds context but has well-known limits. Two people with identical BMI can have TBW% values that differ by 10 percentage points or more, depending on their lean-to-fat ratio. Using BMI and TBW% together helps identify cases where a "normal" BMI masks a low lean mass and low TBW%, a pattern sometimes called "normal-weight obesity."
Electrolyte levels are the clinical layer. Sodium, potassium, and chloride govern how water distributes between compartments. When TBW% trends unexpectedly, a basic metabolic panel can reveal whether the shift is driven by sodium retention, kidney function changes, or hormonal dysregulation. Home electrolyte tracking through hydration drinks or dietary logs gives a rough proxy, but lab values are the only reliable measure.
The smart scale data workout planning guide shows how to layer these metrics into a practical training and recovery routine, which is where the combination becomes most actionable for fitness-focused readers.
The number people obsess over is usually the wrong one
Most people who start tracking TBW% make the same mistake: they treat each reading as a verdict. They see 57.2% on Monday and 55.8% on Tuesday and immediately wonder what went wrong. Nothing went wrong. They had a salty dinner.
The research is consistent on this point. A 2025 scoping review found that the value of BIA-based smart scales lies in trend tracking, not in the precision of any single measurement. The SMF-BIA study showed that a single drink can shift your reading within 30 minutes. Treating that kind of noise as signal is not just unhelpful; it can lead to unnecessary dietary changes or anxiety.
What actually works is building a 10–14 day baseline under consistent morning conditions, then watching the direction of the rolling average. A 1.5% downward trend over two weeks during a fat-loss phase is meaningful. A 0.8% swing between Tuesday and Wednesday is not.
There is also a subtler point worth making: TBW% is most useful when it surprises you. If your weight is stable, your training is consistent, and your TBW% is quietly trending down, that is a signal worth investigating. Maybe you are under-hydrating. Maybe you are losing lean mass. Maybe a medication is affecting fluid balance. The scale did not cause the problem; it surfaced it. That is exactly what a good tracking tool should do.
Use the Uvirello Smart Electronic Weight Scale the same way: as a pattern detector, not a daily verdict machine.
The Uvirello Smart Scale gives you the trend data that actually matters
Reading body water percentage changes accurately requires one thing above all else: consistent, reliable measurements taken under the same conditions every time. That is where most people's tracking breaks down, not because they lack discipline, but because their device makes it harder than it needs to be.
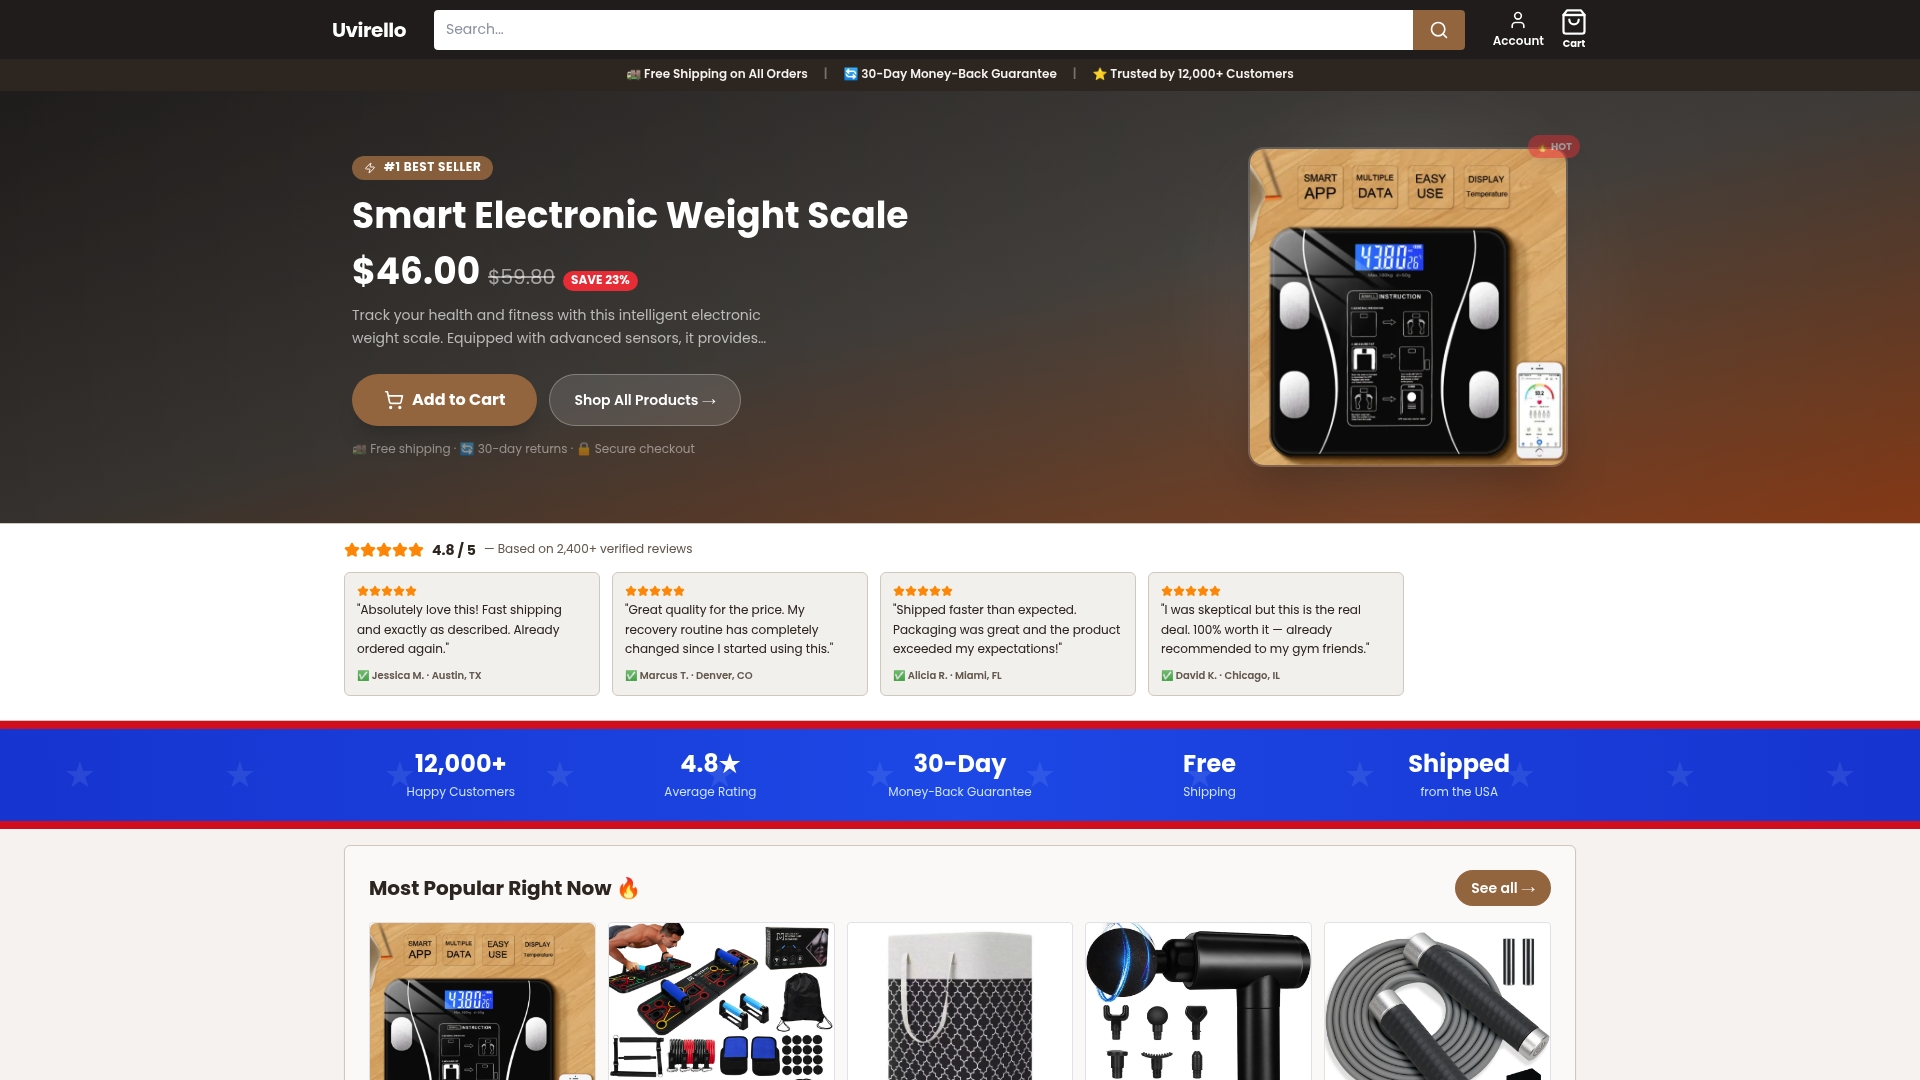
The Uvirello Smart Electronic Weight Scale uses high-precision BIA sensors to deliver body composition readings including TBW%, body fat percentage, and BMI in seconds, with a clean interface that does not bury you in numbers. Over 12,000 customers have rated it 4.8 out of 5, and the consistent feedback is that the trend data, not any single reading, is what changes how people train and eat.
Three reasons it fits the protocol in this article:
- Measurement consistency: High-precision sensors reduce reading-to-reading variability, so your rolling average reflects real change, not device noise.
- Full body composition picture: TBW% alongside weight, BMI, and body fat percentage gives you the multi-metric view that makes any single number meaningful.
- Simple daily habit: The streamlined design makes the morning measurement routine fast enough that you will actually stick to it.
Ready to build a baseline that tells you something real? Check out the Uvirello Smart Scale and start tracking trends that matter.
Sources
The studies and references below form the evidence base for this article. Each is linked to its primary source.
- JMIR mHealth 2025 scoping review on BIA-based smart scales
- Changes in segmental impedances and body composition after fluid consumption (SMF-BIA study)
- Effect of equilibrated hydration changes on TBW estimates by BIA
- Body water percentage from childhood to old age (BIA study, PMC)
- The Water in You: Water and the Human Body (USGS)
- Body water percentage: Average, ideal, how to maintain (Healthline)
This article is general information, not a substitute for advice from a qualified doctor. Consult a qualified healthcare professional about your own circumstances before acting on anything here.