
Hydration genuinely affects how your brain performs, but the effect is specific: the role of hydration in cognitive performance is strongest when you are already fluid-restricted, and it shows up most clearly in sustained attention and complex decision-making. A British Journal of Nutrition review confirms the pattern while flagging that study methods vary widely, making blanket claims unreliable. The practical takeaway: track daily weight trends with a high-precision smart scale rather than waiting for thirst to tell you something is off.
- Sustained attention and judgment are the cognitive tasks most sensitive to fluid loss.
- Rehydration restores baseline function; it does not produce a supernormal boost.
- Tracking trends over days beats any single measurement for spotting fluid shifts.
Table of Contents
- How body water shapes your brain function
- What the research actually shows
- What counts as mild dehydration and how to detect it
- Evidence-based hydration strategies for sharper focus
- How a smart scale helps you track hydration trends
- A simple at-home protocol to test your own hydration sensitivity
- When to call a clinician instead of adjusting your water intake
- Key Takeaways
- Tracking hydration is more personal than most guides admit
- The Uvirello smart scale makes hydration monitoring practical
- Useful sources
How body water shapes your brain function
Your brain is roughly 75% water, and even small drops in total body water set off a chain of physiological changes. Blood volume falls, cerebral perfusion pressure drops, and the neurovascular coupling that delivers oxygen and glucose to active neurons becomes less efficient. Neuroimaging work using multimodal MRI found measurable changes in resting-state brain metrics in frontal and limbic regions after water restriction, even when behavioral test scores did not shift dramatically between groups.
Electrolyte imbalance compounds the problem. Sodium and potassium gradients drive action potentials; when osmolality rises, neural signaling slows. Cortisol also climbs during mild dehydration, and elevated cortisol is independently linked to reduced prefrontal function, the region most responsible for sustained focus and judgment.
The brain can compensate for a while by recruiting additional neural resources, but that compensation has a cost: tasks that demand prolonged effort drain the reserve faster. Simple, brief tasks often show no measurable deficit; it is the long meeting, the complex spreadsheet, the multistep decision that exposes the gap.
Pro Tip: A 0.5–1% overnight weight drop that exceeds your usual morning variation is more likely a fluid shift than fat loss. Log it separately from your weekly trend to avoid misreading your body-composition data.
What the research actually shows
The evidence is real but uneven. Studies on dehydration and cognition consistently find acute improvements in reaction time and attention after water intake when participants were thirsty or fluid-restricted beforehand. A short-term longitudinal study found that adults classified as dehydrated by serum osmolality performed worse on sustained attention tasks, while other cognitive domains showed no consistent deficit.
Where findings diverge is telling:
- Sustained attention and complex decision-making show the most consistent hydration-related effects.
- Simple memory and cognitive flexibility are often unaffected, even at mild dehydration levels.
- Exercise-induced dehydration introduces confounders (heat, fatigue, adrenaline) that make it hard to isolate the hydration effect alone.
- Methodological gaps drive much of the inconsistency: different cognitive tests, weak hydration markers, small samples, and populations ranging from children to older adults.
Key finding: A PMC decision-making RCT showed that 500 mL of water after overnight fasting improved judgment scores independent of subjective thirst, suggesting the cognitive signal precedes the feeling of being thirsty.
The British Journal of Nutrition review calls for standardized cognitive batteries and physiological hydration measures in future research. Until that happens, treat the evidence as directional, not definitive.
What counts as mild dehydration and how to detect it
Mild dehydration in research is typically defined as a body weight loss of roughly 1–2%, or serum osmolality above 295–300 mOsm/kg. At that level, most people do not feel noticeably thirsty, especially older adults and anyone working in a warm environment.
| Marker | What it signals | How to measure at home |
|---|---|---|
| Morning weight vs. baseline | Acute fluid loss overnight | Weigh daily, same time, post-toilet |
| Urine color | Rough osmolality proxy | Pale yellow = adequate; dark amber = likely dehydrated |
| Urine specific gravity | More precise osmolality proxy | Dipstick strips, available at pharmacies |
| Subjective thirst | Lags behind physiological need | Useful but unreliable as a sole indicator |
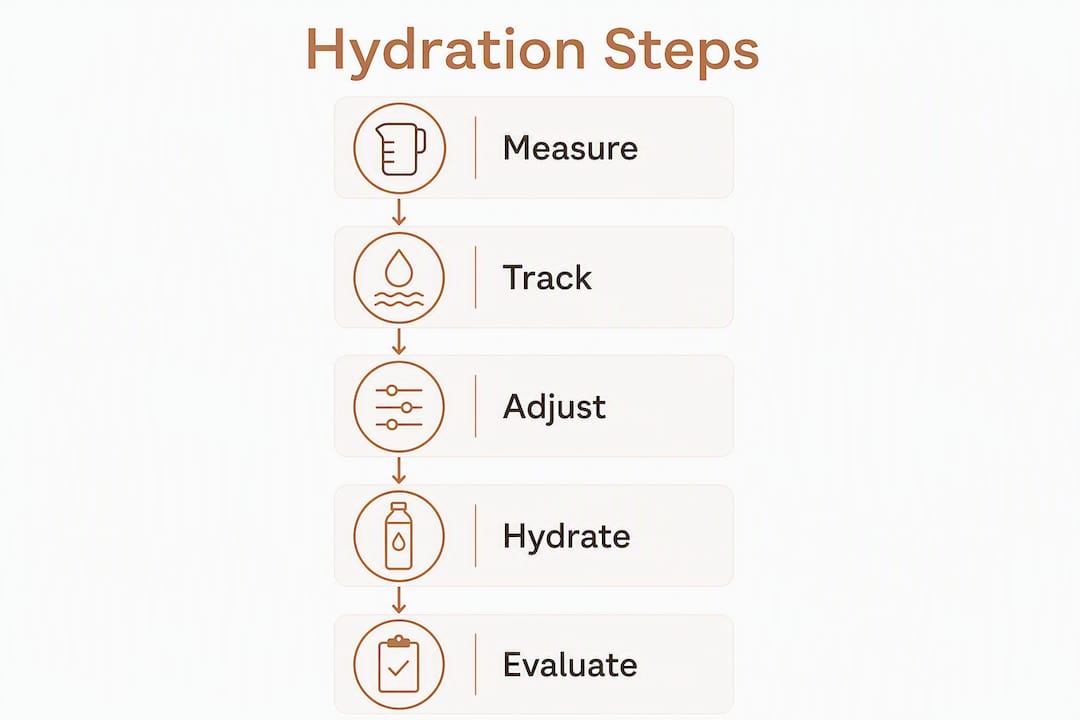
Daily detection steps:
- Weigh yourself every morning immediately after waking and using the bathroom, before eating or drinking.
- Compare to your 7-day rolling average, not yesterday's reading.
- Check urine color on the same morning.
- Flag any day where weight is more than 1% below your rolling average AND urine is dark.
Pro Tip: Control for confounders before concluding you are dehydrated: a heavy meal the night before, a long run, or wearing more clothing than usual can all shift the number. Consistent conditions, same time, minimal clothing, are what make the trend meaningful.
Evidence-based hydration strategies for sharper focus
Maintain fluid intake consistently across the day; the goal is to avoid letting body weight drop more than 1% between morning measurements. That single habit does more for mental clarity than any targeted "hydration hack."
Daily strategies:
- Start with 16 oz of water within 30 minutes of waking.
- Drink small amounts every 60–90 minutes rather than large volumes infrequently.
- Adjust upward on days with heat exposure or exercise; a 1-hour moderate workout can drive a 1–2% body weight fluid loss.
- Monitor your morning weight trend weekly to catch a gradual drift before it affects your afternoon focus.
Timed approach before focused work:
- Drink 8–16 oz of water 30–60 minutes before a prolonged work session or exam.
- Avoid large volumes immediately before sitting down; gastric discomfort is its own distraction.
- Keep a 6–8 oz glass nearby during the session and sip every 45 minutes.
- After the session, weigh yourself if possible and note any weight drop for your log.
A note on caffeine and alcohol: both are diuretics at moderate-to-high doses and can accelerate fluid loss. Caffeine's cognitive benefits are real, but they do not cancel out a hydration deficit. Older adults, people on diuretics, and anyone with kidney or heart conditions should confirm fluid targets with a clinician before changing intake habits significantly.
How a smart scale helps you track hydration trends
High-precision daily weight trends are the most practical home proxy for short-term fluid changes, provided you measure under consistent conditions. A smart electronic scale adds body water percentage via bioelectrical impedance analysis (BIA), which gives useful context but has real limits.
What the metrics tell you:
- Body weight (daily): Best signal for acute fluid shifts; sensitive to 0.1 kg changes on a high-precision scale.
- Body water %: Directional trend indicator; single readings are noisy because hydration state itself affects impedance.
- Body fat % and BMI: Useful for longer-term body-composition tracking; not reliable hydration markers day-to-day.
BIA works by sending a low electrical current through the body and measuring resistance. When you are dehydrated, impedance rises and the algorithm may overestimate body fat. That is why tracking trends beats single readings: a week of consistent morning data smooths the noise.
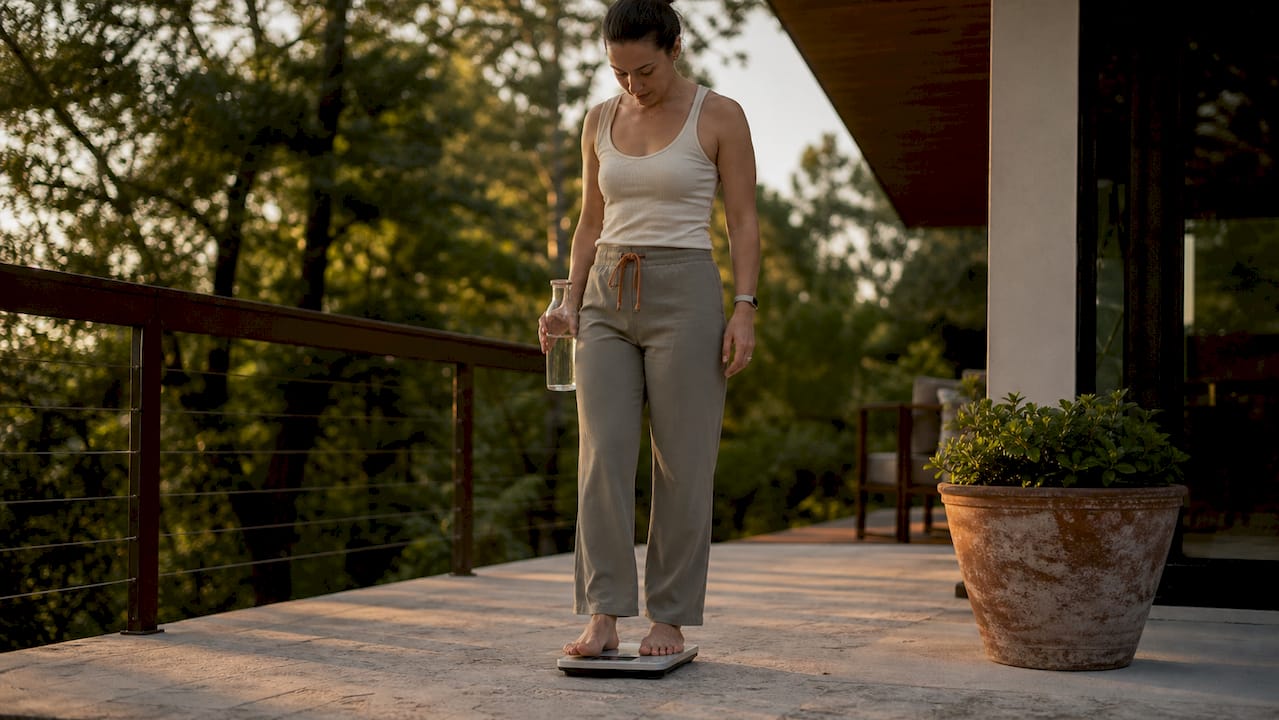
Measurement best practices: same time every morning, post-toilet, minimal clothing, no exercise in the prior hour, no large meal the night before that would inflate the reading.
Pro Tip: Pair your scale log with a simple cognitive note, a 1–5 rating of your morning focus or a quick 2-minute decision puzzle, and record both in the same app or spreadsheet. After two weeks, patterns become visible that no single measurement could reveal. The smart scale data guide from Uvirello walks through exactly this kind of integration.
A simple at-home protocol to test your own hydration sensitivity
A small N-of-1 test can reveal whether your attention or decision-making actually shifts with your hydration status, because population averages may not describe you.
- Baseline week (Days 1–7): Weigh every morning. Drink normally. Rate your morning focus (1–5) and complete a 2-minute online decision puzzle. Log all three numbers.
- Controlled check (Day 8): Stop fluids at 10 PM the night before. Weigh in the morning. Complete the same focus rating and puzzle before drinking anything.
- Rehydration (Day 8, continued): Drink 16 oz of water. Wait 30 minutes. Repeat the focus rating and puzzle.
- Repeat Days 8–10 to get at least three controlled observations.
- Compare: Did your puzzle score or focus rating drop on mornings where weight was 1%+ below baseline? Did it recover after rehydration?
Safety notes:
- Stop immediately and drink water if you feel dizzy, develop a headache, or feel confused.
- Do not attempt this protocol if you have a kidney condition, heart condition, or are on diuretics without medical clearance.
- This is a self-observation exercise, not a clinical test. Consult a clinician if you notice persistent cognitive changes.
Interpreting results: If your scores drop consistently when weight is low and recover after drinking, hydration is likely a meaningful factor for you. If scores are stable regardless of weight, other variables (sleep, stress) may matter more.
When to call a clinician instead of adjusting your water intake
Some symptoms go beyond what self-monitoring can address.
- Confusion or disorientation that does not resolve quickly after drinking
- Fainting or near-fainting after fluid restriction
- Rapid weight loss (more than 2% in 24 hours without intentional restriction)
- Severe dizziness or heart palpitations
- Very dark or absent urine for more than 12 hours
- Ongoing cognitive decline that persists despite consistent hydration
Older adults, people on diuretics, and those with kidney or heart conditions are at higher risk for both dehydration and overhydration. Do not attempt aggressive rehydration (large volumes in a short window) without medical guidance if a chronic condition exists. This article is general health information, not medical advice; confirm any significant changes with your primary care provider.
Key Takeaways
Hydration affects specific cognitive skills most when you are already fluid-restricted, and daily weight trends from a high-precision smart scale are the most practical way to catch that state before it costs you focus.
| Point | Details |
|---|---|
| Sustained attention is most vulnerable | Dehydrated adults scored substantially worse on sustained attention tasks; simple tasks were often unaffected. |
| Rehydration restores, not enhances | Water brings performance back to baseline; it does not produce a cognitive boost beyond your normal level. |
| 1% weight drop is the practical threshold | A morning weight more than 1% below your rolling average, paired with dark urine, is a reliable dehydration signal. |
| Trends beat single readings | Within-subject longitudinal data reveals hydration-related cognitive changes that one-off measurements miss. |
| Uvirello scale for daily monitoring | High-precision sensors and trend aggregation make the Uvirello smart scale a practical home tool for linking weight shifts to focus patterns. |
Tracking hydration is more personal than most guides admit
The research on hydration and cognition is genuinely interesting, but it is also genuinely messy. Population-level reviews tell you that sustained attention is the most sensitive domain and that mild dehydration is the relevant threshold. What they cannot tell you is whether you are one of the people who notices a real focus drop at 1% fluid loss or one of the people who barely registers it.
That gap between the average and the individual is exactly why objective daily tracking matters more than following a generic "drink eight glasses" rule. The most useful thing a smart scale does is not give you a body water percentage on any given Tuesday. It is the pattern across 30 mornings that shows whether your low-weight days reliably coincide with your low-focus days. That correlation, or its absence, is information no population study can hand you.
One pattern worth noting: some people find that their decision-making dips on mornings where weight is 1–1.5% below their rolling average, even when they feel fine. The dip is subtle enough to miss without a log, but consistent enough to act on once you see it. Pairing a scale with even a rough cognitive note turns a passive measurement into something you can actually use.
The Uvirello smart scale makes hydration monitoring practical
Consistent hydration monitoring at home comes down to one thing: a scale precise enough to catch a 0.5 kg fluid shift and reliable enough to build a trend you can trust.
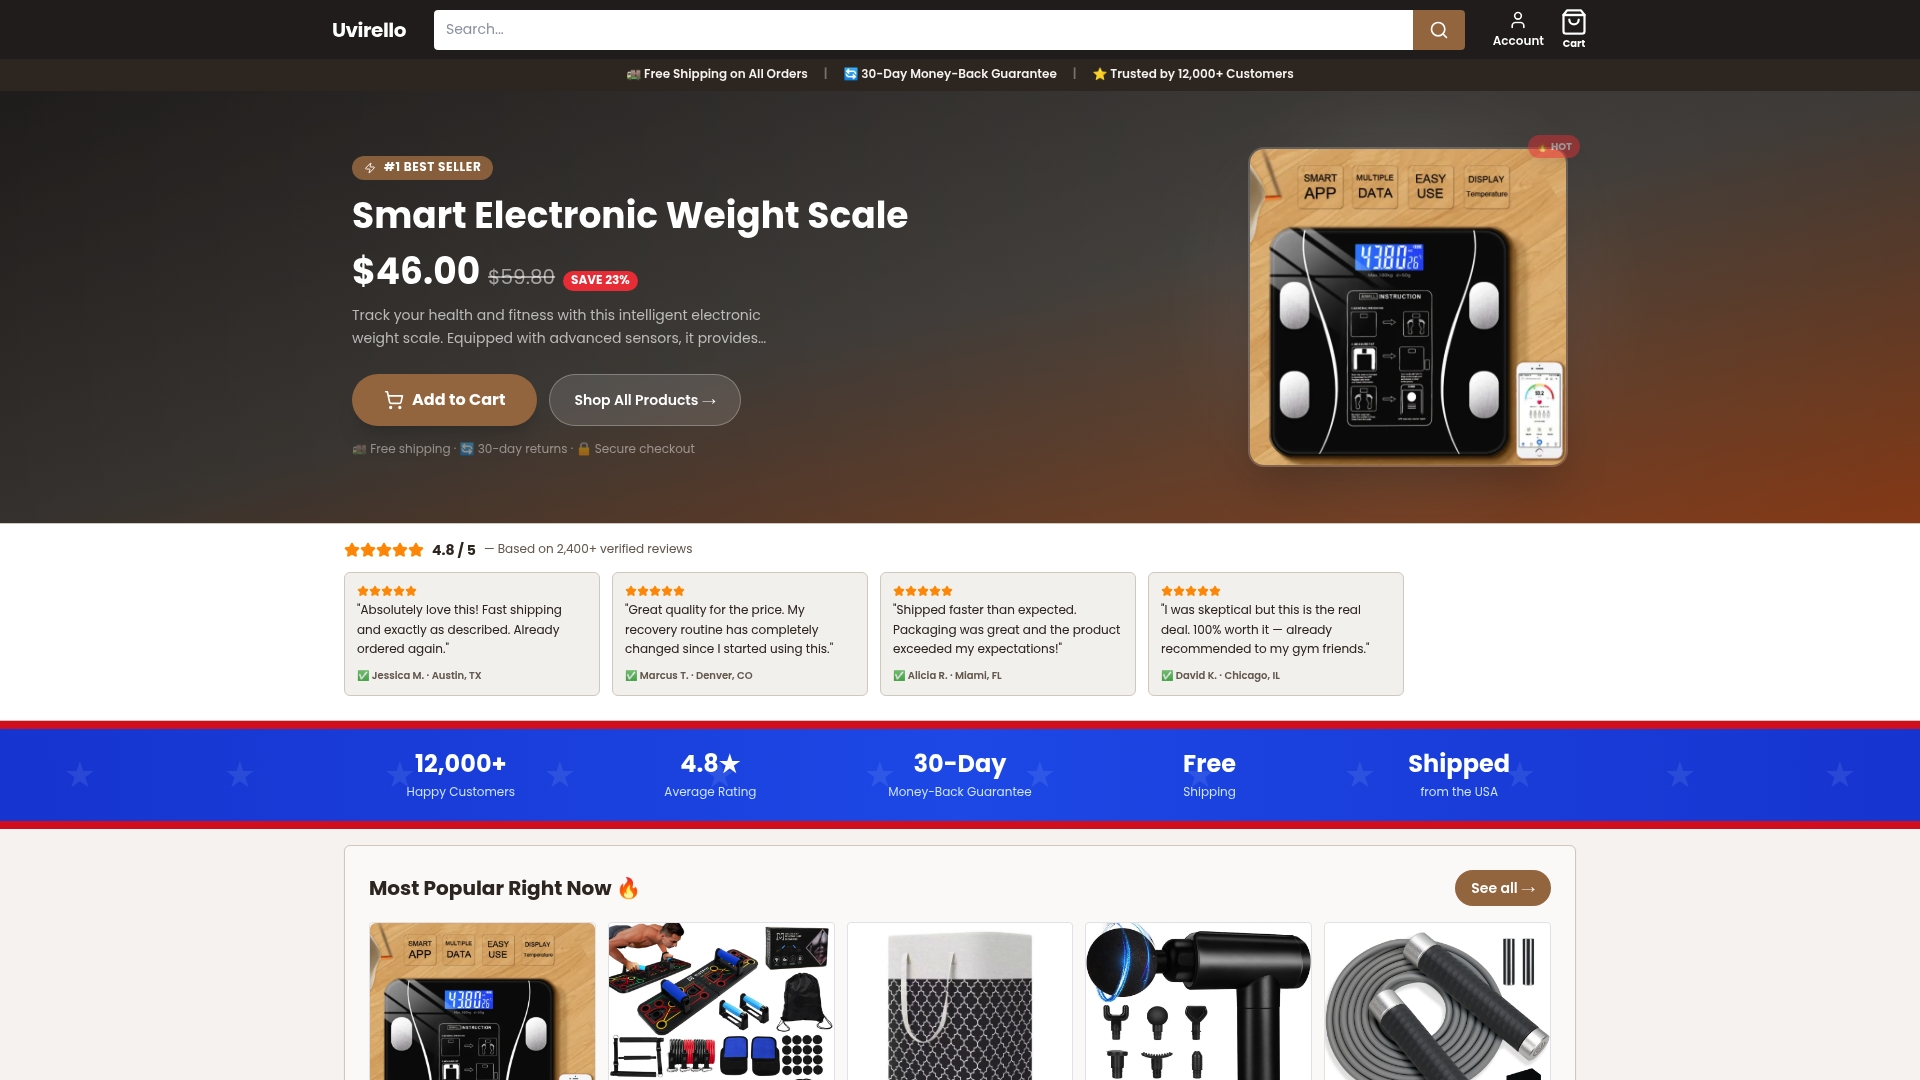
The Uvirello Smart Electronic Weight Scale is built for exactly this kind of daily tracking. High-precision sensors detect small weight changes that matter for hydration monitoring, body water percentage gives directional trend data over time, and automatic multi-user profiles keep household readings separate so your trend stays clean. Over 12,000 customers have rated it 4.8 out of 5, making it one of the most trusted home body-composition tools available.
If the at-home protocol in this article sounds worth trying, the Uvirello scale gives you the measurement foundation to run it properly. See the full product details and start building the trend data that makes self-monitoring actually meaningful.
Useful sources
- British Journal of Nutrition: Effects of hydration status on cognitive performance and mood — Comprehensive review of the field; highlights inconsistent methods and calls for standardized hydration markers.
- PMC: Ad libitum dehydration and sustained attention — Longitudinal study showing sustained attention as the cognitive domain most sensitive to dehydration.
- PMC: Water supplementation and decision-making — RCT demonstrating improved judgment scores after 500 mL water intake, independent of thirst.
- PubMed: Effects of hydration status on cognitive performance and mood — Reports reaction time and attention improvements after water intake in fluid-restricted participants.
- Frontiers in Nutrition: Multimodal MRI and water intake RCT — Neuroimaging evidence of brain-metric changes after hydration intervention in 12-hour water-restricted adults.
- PubMed: Hydration and cognition in older adults, NHANES 2011–2014 — Large survey linking serum osmolality to attention and processing speed, with notable sex differences.