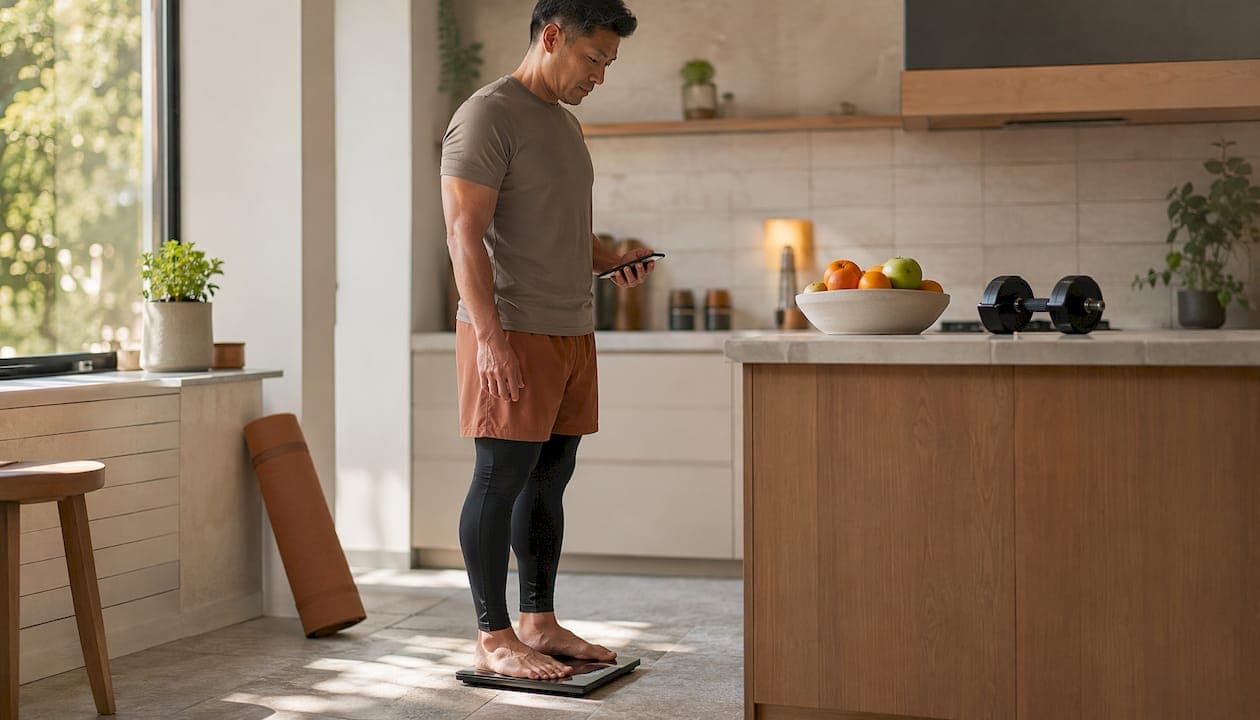
How smart scale data transforms your workout planning
Body weight alone tells you almost nothing useful about your fitness progress. Smart scale data workout planning changes that by giving you body fat percentage, muscle mass, bone density, and hydration levels, so every training decision is grounded in what your body is actually doing. Feed those numbers into your weekly routine and you stop guessing whether to push harder or pull back.
Here is what smart scale data lets you do that a standard scale cannot:
- Target specific goals. Dropping body fat while preserving muscle mass requires a different training split than pure strength building. Your scale's composition data tells you which direction you are actually moving.
- Spot plateaus early. When muscle mass stalls for three consecutive weeks, that is a signal to change volume or nutrition, not to wait another month.
- Track recovery quality. Elevated body water retention after a hard training block often signals inflammation. Catching that trend early helps you schedule rest before fatigue compounds.
- Avoid the weight-loss trap. The number on a traditional scale can drop while muscle mass drops with it, a sign of counterproductive training. Body composition data separates fat loss from muscle loss.
- Set realistic timelines. Watching muscle mass increase by a measurable amount each month gives you a concrete benchmark, not a vague feeling of progress.
Research supports the habit itself: daily self-weighing combined with tailored feedback produced clinically meaningful weight loss and stronger self-monitoring behaviors, even without face-to-face coaching.
Table of Contents
- Why smart scales matter and which metrics to focus on
- How to apply body composition data to your training program
- How to monitor recovery using smart scale metrics
- Common mistakes when using smart scales for workout planning
- A step-by-step guide to integrating smart scale data into your training
- The Uvirello Smart Electronic Weight Scale: built for serious tracking
- Uvirello gives you the data your training plan has been missing
- Key Takeaways
Why smart scales matter and which metrics to focus on
Smart scales use Bioelectrical Impedance Analysis (BIA), a method where a low-level electrical current passes through your body and measures resistance. Because fat tissue resists the current more than muscle does, the scale estimates your body composition from that resistance reading. The BIA method is useful for tracking trends over time, though hydration level, recent exercise, and time of day all influence individual readings.
The metrics worth paying attention to for fitness tracking technology are:
- Body fat percentage. The ratio of fat to lean tissue. This is the single most useful number for adjusting training focus between fat loss and muscle building phases.
- Muscle mass. Tracks whether your strength training is producing actual hypertrophy or just fatigue.
- Bone mass. Relevant for long-term health and for athletes doing high-impact training.
- Body water percentage. Short-term fluctuations here often explain why the scale jumps two pounds overnight. Sustained elevation can indicate inflammation or poor recovery.
Pro Tip: Weigh yourself at the same time every morning, before eating or drinking, after using the bathroom. Consistent conditions are what make BIA readings comparable week to week. A single reading means little; a four-week trend means a lot.
Experienced trainers advocate for this kind of consistent measurement timing precisely because it minimizes bioimpedance variability and makes the data reliable enough to act on.

How to apply body composition data to your training program
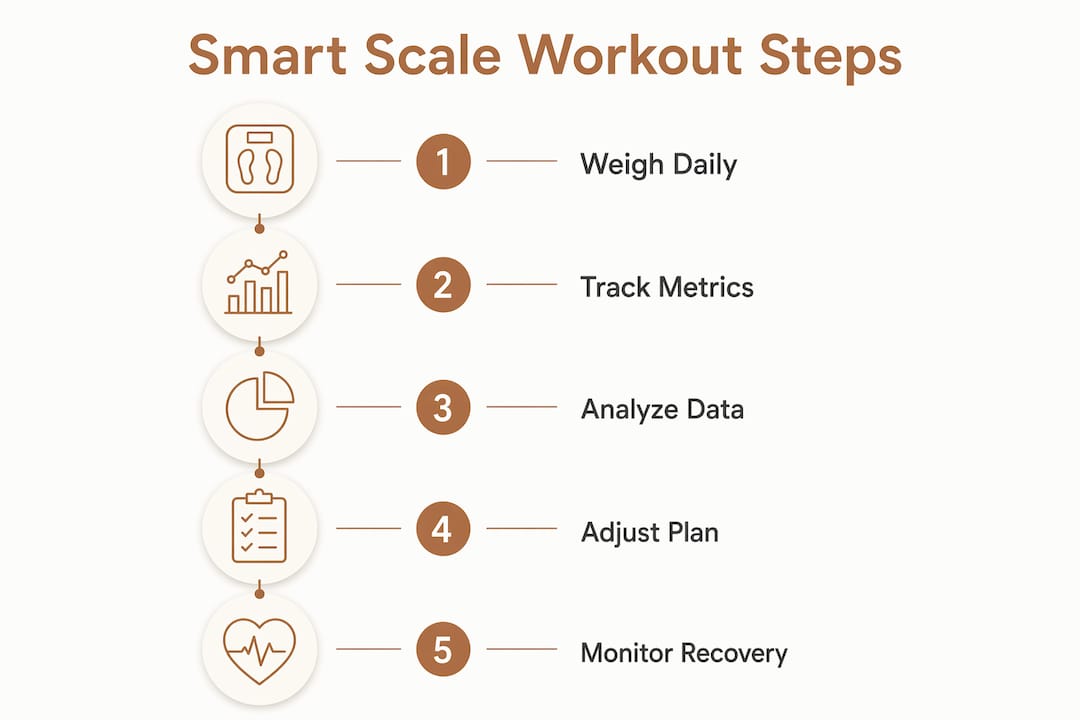
Muscle mass and body fat percentage are the two levers you pull when adjusting a workout program. If body fat is creeping up while muscle mass holds steady, that points to a caloric surplus and possibly too little conditioning work. If muscle mass is flat despite consistent lifting, the program likely needs more volume, better recovery, or a nutrition adjustment.
A practical weekly check-in looks like this:
- Monday morning weigh-in. Log body fat percentage, muscle mass, and body water. Note any significant changes from the previous week.
- Mid-week gut check. If body water is elevated and energy is low, consider reducing training intensity for the next two sessions.
- Friday review. Compare the week's average metrics against the prior week. Look for directional trends, not single-day swings.
- Monthly assessment. Pull four weeks of data and evaluate whether the program is producing the intended shift in body composition.
Combining scale data with performance feedback closes the loop. If your lifts are going up but body fat is also rising, you are likely in a productive muscle-building phase. If lifts are stagnant and body fat is rising, something in the program or nutrition needs to change. Experts recommend pairing scale data with personalized programming rather than treating it as a standalone diagnostic.
For those who want the process automated, AI-driven training platforms can sync smart scale readings to recalibrate calorie targets and training loads dynamically, preventing the program drift that derails most long-term plans.

How to monitor recovery using smart scale metrics
Recovery is where most fitness plans break down, and smart scale data gives you earlier warning signs than soreness alone. Body water percentage is the most sensitive short-term indicator. A spike of two or more percentage points above your personal baseline, especially after a heavy training week, often reflects tissue inflammation rather than genuine hydration.
Watch for these patterns:
- Sustained weight increase without caloric surplus. This frequently signals water retention from muscle damage or systemic stress, not fat gain.
- Muscle mass dip after a hard block. A temporary drop in measured muscle mass can indicate glycogen depletion or overreaching. It usually rebounds within a week of reduced intensity.
- Resting metabolic rate decline. Some scales estimate this metric. A downward trend over several weeks can indicate the body is adapting to a caloric deficit by slowing metabolism, a cue to cycle calories upward.
Pair these signals with subjective measures: sleep quality, motivation, and joint soreness. When the scale shows elevated water retention and you feel flat in the gym, that combination is a reliable signal to take an extra rest day or swap a heavy session for active recovery. Wearable activity trackers have demonstrated durable effects on physical activity for at least six months, but only when recovery is managed well enough to sustain consistent training.
A biometric wearable like the VOLTRA health band can add heart rate variability data alongside your scale readings, giving you a fuller picture of whether your nervous system is ready to train hard.
Common mistakes when using smart scales for workout planning
Most people who buy a smart scale underuse it or misread it. These are the errors that cost the most progress:
- Reacting to single readings. One high body fat reading after a salty dinner means nothing. The trend over three to four weeks is the only number worth acting on.
- Ignoring measurement conditions. Weighing after a workout, after a large meal, or at different times each day produces data that cannot be compared. Inconsistent conditions make the data useless for planning.
- Choosing a scale without app integration. A scale that does not sync to a health app forces you to log data manually, which most people stop doing within two weeks. App connectivity turns raw numbers into visible trends.
- Fixating on body fat percentage alone. A drop in body fat percentage that comes with a drop in muscle mass is not a win. Always read both numbers together.
- Skipping complementary tools. Smart scale data is one input. Heart rate monitors, workout logs, and sleep trackers fill in the gaps that body composition metrics cannot capture. Tracking body composition beats weight tracking precisely because it requires this broader view.
A step-by-step guide to integrating smart scale data into your training
-
Establish a baseline. Weigh yourself every morning for two weeks before changing anything in your program. This gives you a personal average for each metric, which is far more useful than any generic chart.
-
Log data consistently. Use your scale's companion app or a fitness journal to record body fat percentage, muscle mass, and body water each week. Apps that graph trends visually make patterns obvious in a way raw numbers do not.
-
Review trends, not snapshots. At the end of each week, look at the directional movement of your key metrics. Up, down, or flat? That direction, sustained over three or more weeks, is your signal.
-
Adjust workout variables based on what the data shows. Muscle mass trending down despite consistent training? Add a rest day and increase protein intake. Body fat rising over four weeks? Increase conditioning work or tighten the caloric target.
-
Monitor recovery trends and adjust rest days. If body water spikes and performance drops in the same week, that week calls for deload, not a push. Build flexibility into your program so you can act on what the data shows.
-
Add complementary fitness metrics. Weekly fitness tracking works best when scale data sits alongside heart rate, sleep duration, and workout performance logs. No single metric tells the whole story.
The Uvirello Smart Electronic Weight Scale: built for serious tracking
The Uvirello Smart Electronic Weight Scale measures body fat percentage, muscle mass, BMI, bone mass, and body water level, giving you the full composition picture that workout planning actually requires. High-precision sensors and a clean, minimal design make it easy to use consistently, which matters more than any single feature.
Key benefits that fitness-focused people report:
- Comprehensive metrics in one step. No separate devices needed for the core body composition data points.
- User-friendly app sync. Data transfers automatically, so trends are visible without manual logging.
- Sleek, durable build. The design fits a modern home gym without looking clinical.
Over 12,000 customers have rated the Uvirello scale at an average of 4.8 out of 5, and users consistently report measurable improvements in their fitness progress after incorporating the scale's insights into their routines. That level of satisfaction across a large user base reflects both data reliability and ease of use, two things that determine whether a tracking tool actually gets used long-term.
Uvirello gives you the data your training plan has been missing
Most fitness plans stall not from lack of effort but from lack of feedback. The Uvirello Smart Electronic Weight Scale gives you the body composition data, body fat percentage, muscle mass, bone mass, and hydration, that turns a generic program into one that responds to what your body is actually doing week to week.
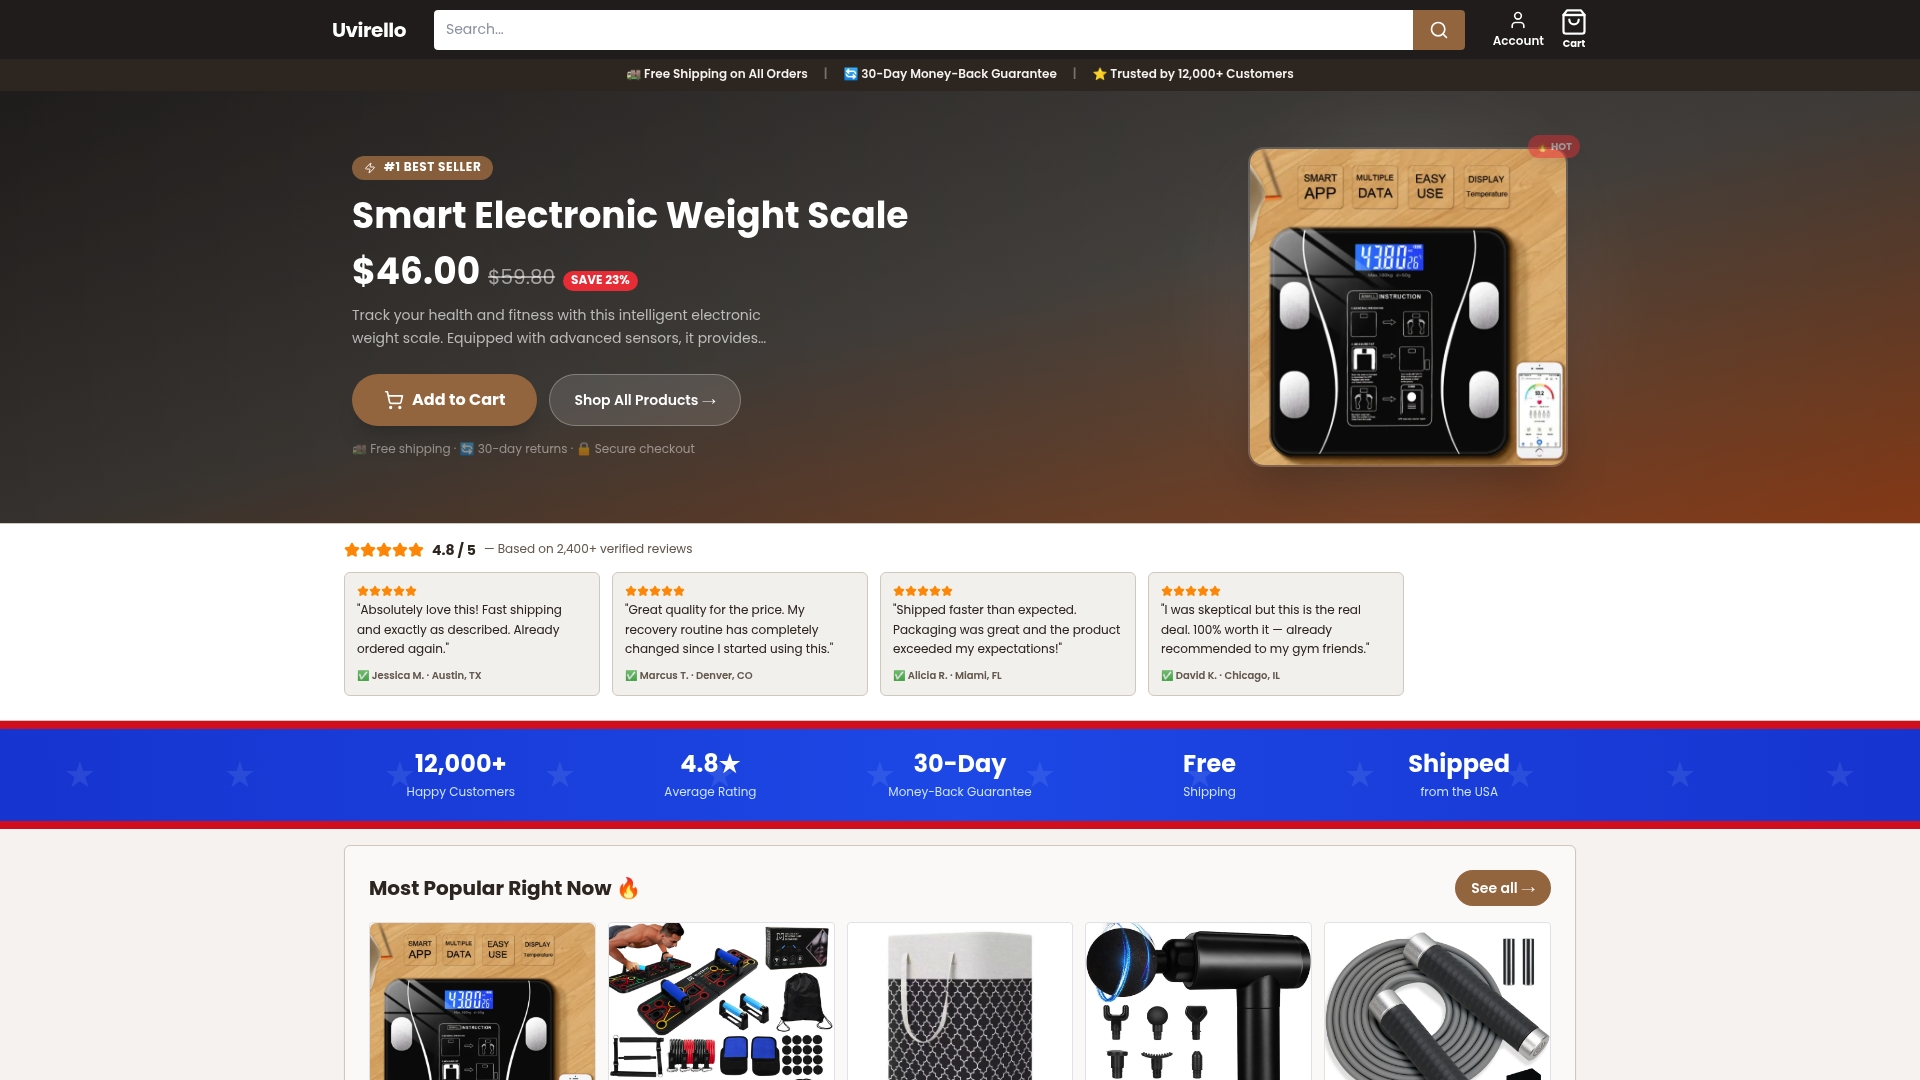
Where a traditional scale gives you one number, Uvirello gives you a full picture. That picture is what lets you decide whether this week calls for a harder push or a smarter recovery. With over 12,000 satisfied customers and a 4.8/5 rating, it is the tracking foundation that serious fitness goals require. Visit Uvirello to see the full specs and get started with data-driven training today.
Key Takeaways
Smart scale data is most effective when you track body fat percentage and muscle mass together as a pair, then act on multi-week trends rather than daily fluctuations.
| Point | Details |
|---|---|
| Track trends, not snapshots | Review body fat and muscle mass over three to four weeks before adjusting your program. |
| Consistent timing matters | Weigh every morning under the same conditions to make BIA readings comparable and reliable. |
| Recovery signals are in the data | Elevated body water percentage alongside low energy is a reliable cue to reduce training intensity. |
| Combine tools for full picture | Pair smart scale metrics with heart rate and sleep data to catch what body composition alone misses. |
| Uvirello Smart Electronic Weight Scale | Tracks body fat, muscle mass, BMI, bone mass, and hydration; rated 4.8/5 by over 12,000 customers. |