
A weight trend is a moving average of your daily weigh-ins, calculated to smooth out water retention, sodium swings, and other short-term noise so you can see your real direction. Most trackers default to a moderate-length window because it balances responsiveness with stability. The takeaway: stop reacting to single-day numbers and start watching the trend line move.
TL;DR:
- Using an exponential moving average responds faster to genuine weight changes than a simple moving average, making it preferable for weight trend tracking.
- A 14-day window offers the best balance between responsiveness and noise reduction for most weight-loss tracking needs.
- Interpolating missing data points prevents distortion in trend lines caused by skipped weigh-ins or inconsistent weighing habits.
- Consistently measuring weight under the same conditions and with a precise scale is crucial for meaningful trend analysis.
- Trusting the trend line over raw daily numbers helps avoid overreacting to short-term fluctuations caused by water retention or hormonal cycles.
Table of Contents
- Weight Trend Moving Average Types: SMA, EMA, and Weighted Windows
- How Moving Averages Turn Noisy Weigh-Ins Into a Trend Line
- Choosing Your Smoothing Window: 7-Day, 14-Day, or 30-Day
- How to Calculate Your Weight Trend: SMA and EMA Step by Step
- Reading the Trend Line Without Overreacting to It
- What to Look for in Apps and Tools That Track Trends
- Expert Tips for Trustworthy Trend Tracking
- Why Precise, Consistent Inputs Matter More Than the Math
- Why I Trust the Trend Line Over the Scale Number
- Sources
Weight Trend Moving Average Types: SMA, EMA, and Weighted Windows
Not all moving averages treat your data the same way, and the method you pick changes how fast the line reacts to a real shift versus a bad night's sleep.
The Simple Moving Average (SMA) takes your last N weigh-ins, adds them up, divides by N, and treats every day equally. It's the easiest to understand and calculate by hand, which makes it a solid starting point if you're building your own spreadsheet. Its weakness: a 30-day SMA gives just as much weight to a reading from four weeks ago as one from yesterday, so it lags behind real changes.
The Exponential Moving Average (EMA) fixes that by weighting recent days more heavily and letting older data fade out gradually. According to the open-source Withings weight smoother project, EMA is often the preferred method in weight-tracking tools because it responds faster to genuine trend shifts while still filtering daily noise. That responsiveness comes from a decay factor, often described in terms of a half-life in days rather than a fixed count of readings.
Weighted and tapered windows sit between these two. Instead of a hard cutoff or a smooth exponential decay, they assign custom weights, heavier in the middle, lighter at the edges, that can be tuned mathematically. Research on optimal weight window design frames this as a convex optimization problem: for a given amount of smoothing, a symmetric tapered window can minimize squared error better than a flat SMA.
A few other distinctions matter in practice:
- Moving median instead of moving average resists outliers, useful if you had one wildly inaccurate reading (dead scale battery, post-meal weigh-in) that would otherwise skew a small window.
- Centered averages use days before and after each point, which reduces bias but can't be calculated for the most recent days since future data doesn't exist yet.
- Trailing averages only look backward, so they're always calculable in real time but carry more lag by design.
For everyday tracking, EMA or a trailing SMA covers nearly every use case. Centered averages and tapered windows are more useful for retrospective analysis than day-to-day decisions.
How Moving Averages Turn Noisy Weigh-Ins Into a Trend Line
The math behind a weight trend line isn't complicated, but the details of how it handles gaps and noise are what separate a useful tool from a misleading one.
Start with missing data. Life happens. You skip a Sunday weigh-in, or you're traveling and forget the scale entirely. Most trend calculators use linear interpolation to fill that gap, estimating what the missing value probably was based on the readings before and after it. This keeps the average from getting distorted by treating a skipped day as zero or by simply ignoring it and compressing the timeline. MacroFactor's documentation on weight trend confirms this is standard practice: the trend calculation emphasizes recent weigh-ins while interpolating gaps so transient fluctuations don't distort the picture.

EMA-based tools go a step further with time-based decay. Rather than counting "the last 7 readings," they measure elapsed days and decay the influence of older data accordingly, which matters if you weigh yourself five times one week and twice the next.
Pro Tip: If your tracker lets you choose between a reading-count window and a day-based window, pick the day-based one. It keeps your trend honest even when your weigh-in habit gets inconsistent.
Conceptually, smoothing works like a low-pass filter in signal processing: it strips out the "high-frequency noise", the rapid up-and-down swings from water weight and digestion, while letting the "low-frequency signal", your actual fat loss or gain trajectory, come through clearly.
- Centered averaging reduces bias in retrospective analysis because it draws from both directions in time.
- Trailing averaging is always current but trades that bias reduction for real-time usability.
One useful reference point: a well-tuned tapered window can shave measurable error off a simple flat-weight average, according to the optimal window research cited earlier, though for most home trackers the difference is marginal compared to just picking a sensible window length.
Choosing Your Smoothing Window: 7-Day, 14-Day, or 30-Day
The window length you choose determines how quickly your trend reacts and how much noise slips through. There's no universal right answer, but there are clear trade-offs.
- 7-day window. Reacts fast to real changes but still shows visible wobble from sodium, hydration, and hormonal cycles. Good for people who weigh in daily and want quick feedback, less good if you're prone to reading too much into a short bump.
- 14-day window. The most commonly recommended default for weight-loss tracking. It's long enough to smooth out a bad weekend but short enough to catch a genuine plateau within a few weeks. Coaching resources on smoothed weight trend tracking point to 14 days as the practical sweet spot between responsiveness and noise suppression.
- 30-day window. Extremely smooth, almost a straight line in most cases, but it lags roughly two weeks behind your actual trajectory. Useful for long-term reports, less useful for deciding whether this week's plan is working.
How often you weigh yourself changes which window fits. If you step on the scale daily, a 7 or 14-day window has enough data points to smooth properly. If you only weigh in two or three times a week, a shorter window can look choppy simply from having too few readings, so a 14 or even 21-day window compensates for the sparser input.
Pro Tip: Test a window before committing to it. Plot your trend line against your raw weigh-ins for the past month. If the trend line still jumps noticeably day to day, extend the window. If it barely moves for weeks even though your raw weights are clearly drifting, shorten it.
A quick stability check: watch your weekly rate-of-change number, not just the trend line itself. If that rate keeps flipping between "losing" and "gaining" week over week, your window is too short for your data.
How to Calculate Your Weight Trend: SMA and EMA Step by Step
You don't need special software to build a basic trend line, a spreadsheet and a few formulas get you most of the way there.
- Gather your daily weigh-ins. Log at least 7 to 14 consecutive days, filling any missing day with a straight-line interpolation between the days on either side of the gap.
- Calculate a 7-day SMA. Add the last 7 values and divide by 7. Example: if your week's weights (in pounds) are 182.4, 181.9, 183.1, 182.0, 181.5, 182.8, and 181.2, the sum is 1,274.9. Divide by 7 and your SMA is 182.13 pounds.
- Move the window forward one day at a time. Drop the oldest value, add the newest one, recalculate. That rolling recalculation is what turns a single number into a line.
- Calculate an EMA using a smoothing factor. The formula is:
EMA_today = (Weight_today × alpha) + (EMA_yesterday × (1 − alpha)). Alpha is derived from your chosen half-life; a shorter half-life means a higher alpha and a more reactive line. The Withings weight smoother documentation explains mapping alpha to a half-life in days so you can think in time rather than an abstract decimal. - Build centered vs. trailing versions in your sheet. For a trailing average, reference only past rows. For a centered average, reference rows both before and after the target date, which means the most recent few days won't have a centered value until more data arrives.
- Chart both the raw weights and the smoothed line together. The gap between them is exactly the noise you're filtering out.
Reading the Trend Line Without Overreacting to It
A trend line is always looking backward, which is exactly what makes it useful and exactly what confuses people who expect it to match today's scale reading.
During active weight loss, your trend line typically sits above your most recent raw weigh-ins, because it's still averaging in slightly higher numbers from days ago. During a gain phase, it works the other way: the trend sits below your current weight. MacroFactor notes this lag is a feature, not a flaw, since understanding it prevents you from panicking over a raw number that's simply below or above where the trend has caught up to yet.
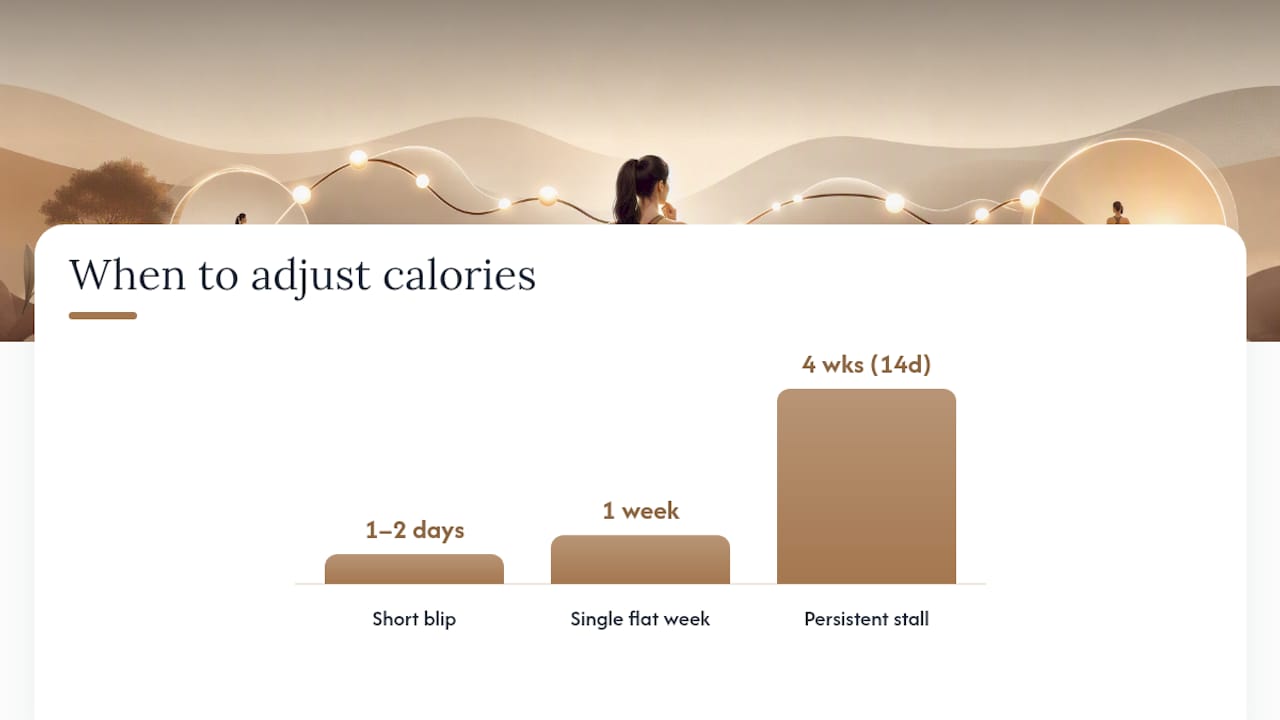
So what counts as a real stall worth acting on? A single flat week means very little. A 14-day trend that stays essentially flat across four consecutive weeks is a much stronger signal that intake, output, or both need adjusting.
- Wait for a persistent change before adjusting calories, not a one or two-day blip.
- Avoid large calorie swings in response to short-term stalls, since your body's water balance alone can mask real fat loss for a week or more.
- Confirm with a second metric when possible, checking whether body composition trends move in the same direction as your weight trend before overhauling your plan.
Pro Tip: Weigh yourself under the same conditions every time, morning, after using the bathroom, before eating, same scale, same spot on the floor. Inconsistent conditions add noise that no moving average can fully correct.
What to Look for in Apps and Tools That Track Trends
Not every scale or app treats trend data the same way, and the features that matter most are the ones that decide whether the number you're looking at is trustworthy.
Broadly, the tools fall into a few categories: smart-scale dashboards that calculate trend automatically from synced weigh-ins, standalone nutrition and weight apps that let you log manually, spreadsheets you build yourself, and open-source local tools for people who want full control over the math.
Whatever category you use, look for:
- An adjustable window so you can switch between 7, 14, and 30 days instead of being locked into one default.
- An EMA option, not just SMA, if you want a trend that reacts faster to real shifts.
- Clear gap handling, ideally interpolation rather than silently skipping missing days.
- Both raw and trend data visible on the same chart, so you can see exactly how much smoothing is happening.
Body composition numbers, body fat percentage and muscle mass especially, are noisier than weight alone and generally need a longer window to smooth properly, a point Withings' open-source dashboards illustrate well when comparing weight and composition trend charts side by side. The best tools show the trend line first and the raw number second, precisely because that ordering nudges you toward better decisions.
Expert Tips for Trustworthy Trend Tracking
Focusing on the smoothed trend rather than the daily number changes behavior in a measurable way. People who treat the trend line as their primary signal tend to make smaller, steadier adjustments to their plan and avoid the large, unnecessary calorie swings that come from panicking over a single bad weigh-in.
That behavioral shift is the entire point of smoothing your data. A rule worth adopting: require a persistent change in your trend smoothed over about two weeks for multiple weeks before you adjust your calorie target, and check that a second signal, like body composition data, agrees with the direction before making a bigger change.
A short checklist for reliable tracking: weigh yourself at a consistent time and under consistent conditions, log at least four to five days a week for the interpolation math to work well, and default to a 14-day window unless you have a specific reason to widen or narrow it.
Pro Tip: Set your default window to 14 days and leave it alone for a full month before adjusting. Constantly switching windows makes it impossible to tell whether your body changed or your math did.
Why Precise, Consistent Inputs Matter More Than the Math
Every formula in this article, SMA, EMA, interpolation, decay, only works as well as the numbers you feed it. A trend line built on inconsistent, imprecise readings will smooth garbage into slightly smoother garbage.
That's the real value of a high-precision scale. Uvirello's Smart Electronic Weight Scale uses sensors built for consistent, repeatable readings every time you step on it, along with body composition metrics like body fat percentage and BMI that give your trend analysis more dimensions to work with than weight alone.
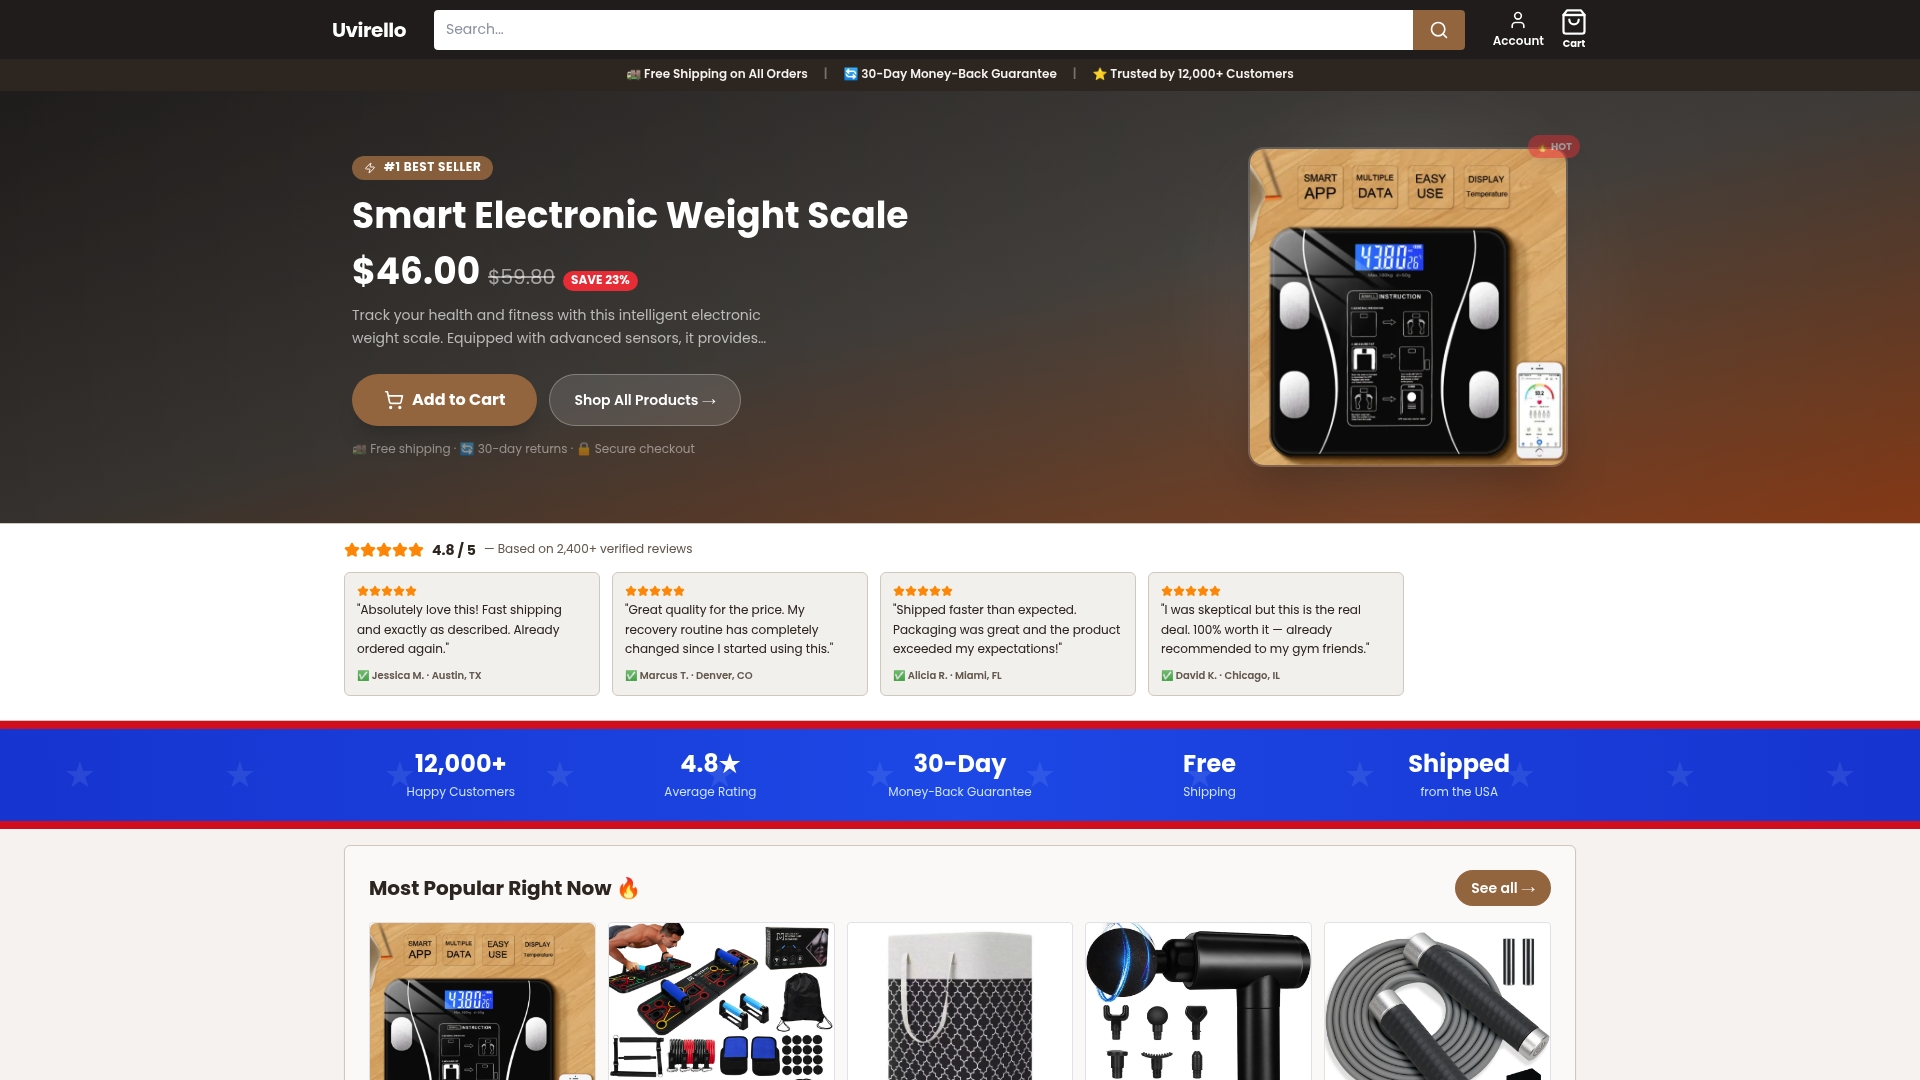
Over 12,000 customers have rated Uvirello's scale an average of 4.8 out of 5, largely because consistent daily inputs are what make any moving average worth calculating in the first place. If your current scale gives you numbers that jump around for no physical reason, no window length will fix that at the source. Check out the Uvirello Smart Electronic Weight Scale and give your trend line the steady, accurate inputs it needs to actually mean something.
Why I Trust the Trend Line Over the Scale Number
Most people quit their plan not because it stopped working, but because a single bad reading convinced them it did. The math in this article isn't academic exercise, it's a defense against your own reaction to noise. A 14-day trend won't lie to you the way a Tuesday morning weigh-in after a salty dinner will. If you want to go deeper on why trends beat single readings, read our piece on how tracking trends beats single health readings, or on building smarter decisions from your health data.
— Jacob
Sources
- Weight Trend | MacroFactor
- marceauboul/withings-weight-smoother
- ArXiv — paper on optimal weight windows for smoothing