
A holistic health tracking system is a unified platform that pulls data from multiple biological, environmental, and lifestyle sources to give you a complete, continuous picture of your health. Most people track one or two metrics, like weight or step count, and wonder why they never get real answers. The difference is integration. When you build a holistic health tracking system that connects wearables like Apple Watch or Garmin, continuous glucose monitors (CGMs), environmental sensors, and lab reports, you stop collecting data and start generating insight. This guide walks you through every layer: the domains to cover, the tools to use, the automation to set up, and the practices that keep it running long term.
What are the essential health domains and data sources to include?
A complete system integrates data across seven core domains: physiome, metabolome, genome, exposome, microbiome, anatome, and epigenome. Each domain captures a different layer of your biology. Ignoring even one creates blind spots that single-metric trackers can never fill.
The table below maps each domain to its key metrics and the tools that collect them.
| Domain | Example metrics | Primary data sources |
|---|---|---|
| Physiome | Heart rate, HRV, sleep stages | Apple Watch, Garmin, Oura Ring |
| Metabolome | Blood glucose, ketones, metabolites | CGM (Dexcom, Libre), lab panels |
| Genome | Genetic variants, ancestry markers | 23andMe, Nebula Genomics |
| Exposome | Air quality index, UV exposure, toxins | AQI sensors, environmental monitors |
| Microbiome | Gut bacteria diversity, pathogen load | Viome, Thorne gut test kits |
| Anatome | Body composition, organ imaging | Smart scales, DEXA scans |
| Epigenome | Methylation patterns, biological age | Elysium Health, TruAge tests |
Platforms that do this well aggregate data from over 15 sources to build a unified vitality score. That number matters because it forces the system to weigh tradeoffs. A great sleep score alongside a spiking glucose trend tells a different story than either metric alone. Tracking body composition rather than raw weight is a good example of this principle in action. The goal is a longitudinal health narrative, not a daily snapshot.
Pro Tip: Add your exposome data early. Most people skip air quality and temperature sensors, but environmental inputs often explain metabolic anomalies that wearables alone cannot.
What tools and technologies do you need to build your system?
Hardware
Self-hosted personal health systems typically cost between $50 and $150 for hardware, covering devices like Raspberry Pi 4 and a set of environmental sensors. That price range puts a functional local server within reach for most people. Software costs drop to $0 when you use open-source platforms, which is the standard approach for privacy-first builds.
Software stack
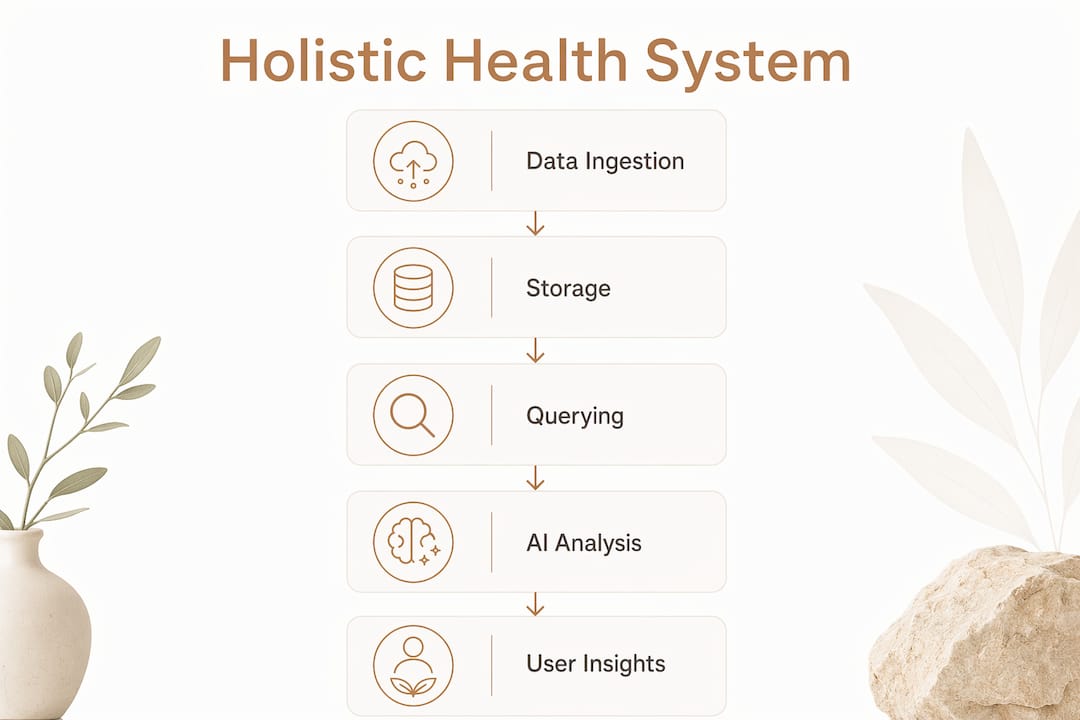
The software layer has three jobs: ingest data, store it, and make it queryable. For ingestion, open-source tools like Node-RED handle API calls from wearables and health platforms. For storage, PostgreSQL works well for structured biometric data, while Firestore suits real-time syncing across devices. For the interface, Grafana turns raw database tables into readable dashboards without writing a single line of display code.
AI components
AI tools like Claude or locally hosted large language models (LLMs) handle the unstructured data problem. Lab PDFs, doctor notes, and food logs do not fit neatly into a database row. AI agents parse these files, extract values, and map them to the correct domain. Without AI-enabled querying, a system is just a log. With it, you can ask "Why did my HRV drop last Tuesday?" and get a cited, cross-domain answer.
| Function | Tool options | Notes |
|---|---|---|
| Data ingestion | Node-RED, custom Python scripts | Connects wearable and health APIs |
| Storage | PostgreSQL, Firestore | Structured and real-time options |
| Analysis | Claude, local LLMs | Parses PDFs, notes, unstructured logs |
| Dashboard | Grafana, Metabase | Visualizes trends without custom code |
| Hardware host | Raspberry Pi 4 | Low-cost local server for privacy-first builds |
Pro Tip: Choose local-first storage from day one. Privacy-first architectures use encrypted local containers or private cloud vaults, giving you 100% data ownership. Retrofitting privacy into a cloud-first system later is painful and often incomplete.
How do you integrate and automate data collection and analysis?
Building a functional ingestion pipeline takes 5–10 hours of setup, including API integration, database configuration, and AI agent setup. That is a one-time investment. After that, the system runs continuously with minimal manual input. Connected devices and IoT sensors now make this kind of automation accessible without a software engineering background.
Follow these steps to get from zero to a running pipeline:
- Connect wearable APIs. Register developer accounts with Apple HealthKit, Garmin Connect IQ, or Fitbit Web API. Pull heart rate, HRV, sleep, and activity data on a scheduled basis, typically every 15 minutes or hourly.
- Set up environmental data feeds. Use AQI APIs like OpenAQ or local sensors connected to your Raspberry Pi. Log temperature, humidity, and air quality alongside biometric data.
- Ingest clinical and lab data. Configure an OCR pipeline using tools like Tesseract or a cloud OCR service to extract values from lab PDF reports automatically. Automated OCR parsing enables longitudinal lab tracking without manual data entry.
- Build your database schema. Create tables or collections for each domain. Tag every record with a timestamp and source identifier so you can filter by domain or date range later.
- Configure AI agents. Point Claude or a local LLM at your unstructured data folder. Write a prompt template that instructs the agent to extract named values, assign them to domains, and flag anomalies against your personal baseline.
- Set up correlation analysis. Schedule a weekly job that runs cross-domain queries. For example, correlate sleep stage data with glucose readings and AQI levels from the same nights.
- Test with 30 days of data. Run the full pipeline for a month before drawing conclusions. Thirty days gives you enough data to separate signal from noise.
The most common mistake is connecting too many sources at once before validating any single feed. Start with your wearable and one lab source. Confirm the data is clean and correctly mapped before adding the next domain.
Pro Tip: Use a messaging bot on Telegram or WhatsApp for manual data entry like mood, food, and symptoms. Asynchronous logging via bots cuts drop-off rates dramatically in the first 30 days compared to app-based manual entry.
What best practices turn raw data into real health insights?
Raw data becomes intelligence through sensor fusion and knowledge graph modeling. Sensor fusion combines physiological measurements with environmental and lifestyle data to reveal correlations that no single metric can show. A sleep score alone is noise. A sleep score correlated with the previous day's glucose variability, evening AQI, and caffeine intake is a finding.
Key practices that separate high-value systems from expensive spreadsheets:
- Use knowledge graphs, not just time-series logs. Knowledge graph structures outperform simple logs by connecting biomarkers, medications, lifestyle events, and environmental nodes. Weighted edges validated by statistical correlation surface non-obvious relationships.
- Query with natural language. AI-first systems let you ask questions in plain English over your full health history. This turns a passive database into an interactive health record.
- Track optimal ranges, not just normal ranges. Personalized optimal health ranges detect personal decline earlier than standard lab reference ranges. Your "normal" is not the population average.
- Prioritize longitudinal data over snapshots. Episodic snapshotting misses continuous trends. Cumulative records that include hereditary artifacts enable predictive, not reactive, health management.
- Log asynchronously. Reduce friction by capturing food, mood, and symptoms through voice notes or messaging bots rather than structured forms. Compliance drops when entry feels like a chore.
Tracking trends over single readings is the core discipline here. A single elevated cortisol reading means little. Six weeks of elevated cortisol correlated with poor sleep and high AQI is a pattern worth acting on.
How do you troubleshoot common challenges and keep your system running?
Data overload is the first problem most people hit. When every domain feeds data every hour, the volume becomes unmanageable without filtering. Set alert thresholds for each metric so the system only surfaces readings outside your personal baseline. Everything else stays in the database for later correlation queries.
Common challenges and their fixes:
- Data noise: Apply a rolling average to smooth short-term spikes. A single bad night of sleep should not trigger an alert.
- Privacy risks: Use encrypted local storage or a private cloud container. Never route sensitive health data through third-party analytics platforms without reviewing their data policies.
- Compliance drop-off: Replace manual app entry with chatbot-based logging. Lower friction means higher consistency.
- Technical drift: Schedule a monthly audit of your API connections. Wearable manufacturers update their APIs regularly, and broken connections silently drop data.
- Interpretation errors: Let AI flag trends but make decisions yourself. AI correlation is a starting point, not a diagnosis.
The biggest long-term risk is not technical failure. It is losing the habit of reviewing your data. Build a weekly 15-minute review into your schedule the same way you schedule a workout.
Pro Tip: Ask your AI agent to produce a weekly summary that highlights only the three most significant trends. This prevents the system from becoming a wall of numbers you stop reading.
Key Takeaways
A well-built personal health tracking system integrates at least seven biological and environmental domains, uses AI to query that data in natural language, and stores everything locally with full encryption for long-term, predictive health management.
| Point | Details |
|---|---|
| Cover all seven domains | Include physiome, metabolome, genome, exposome, microbiome, anatome, and epigenome for complete coverage. |
| Use open-source tools | Hardware costs $50–$150; software is free with platforms like PostgreSQL, Grafana, and Node-RED. |
| Automate ingestion early | Set up API connections and OCR pipelines in the first week to eliminate manual data entry. |
| Apply sensor fusion | Correlate data across domains weekly to find patterns that single metrics cannot reveal. |
| Protect your data | Use local-first or encrypted cloud storage from day one to maintain full data ownership. |
What I have learned after building my own health tracking system
The part nobody tells you upfront is that the system itself is not the hard part. Connecting APIs, setting up a Raspberry Pi, and configuring Grafana takes a weekend. The hard part is deciding what questions you actually want to answer. I spent the first two months collecting everything and analyzing nothing. The data pile grew. The insight did not.
What changed things was treating the AI layer as a conversation partner, not a reporting tool. When I started asking specific questions, like why my HRV was consistently lower on days after high-AQI evenings, the system started paying off. That single correlation led me to add an air purifier in my bedroom. My average HRV improved within three weeks. No doctor had ever flagged that connection because no single appointment captures that kind of longitudinal, multi-domain data.
The other lesson is privacy. Once you see how much data a complete system generates, you will never want it sitting on someone else's server. Local-first storage is not paranoia. It is the only architecture that makes sense for data this personal. Build it right the first time.
— Jacob
Where to go next with your health tracking setup
Starting a personal health tracking system does not require building everything at once. The best approach is to add one data domain at a time, validate the feed, and then expand.
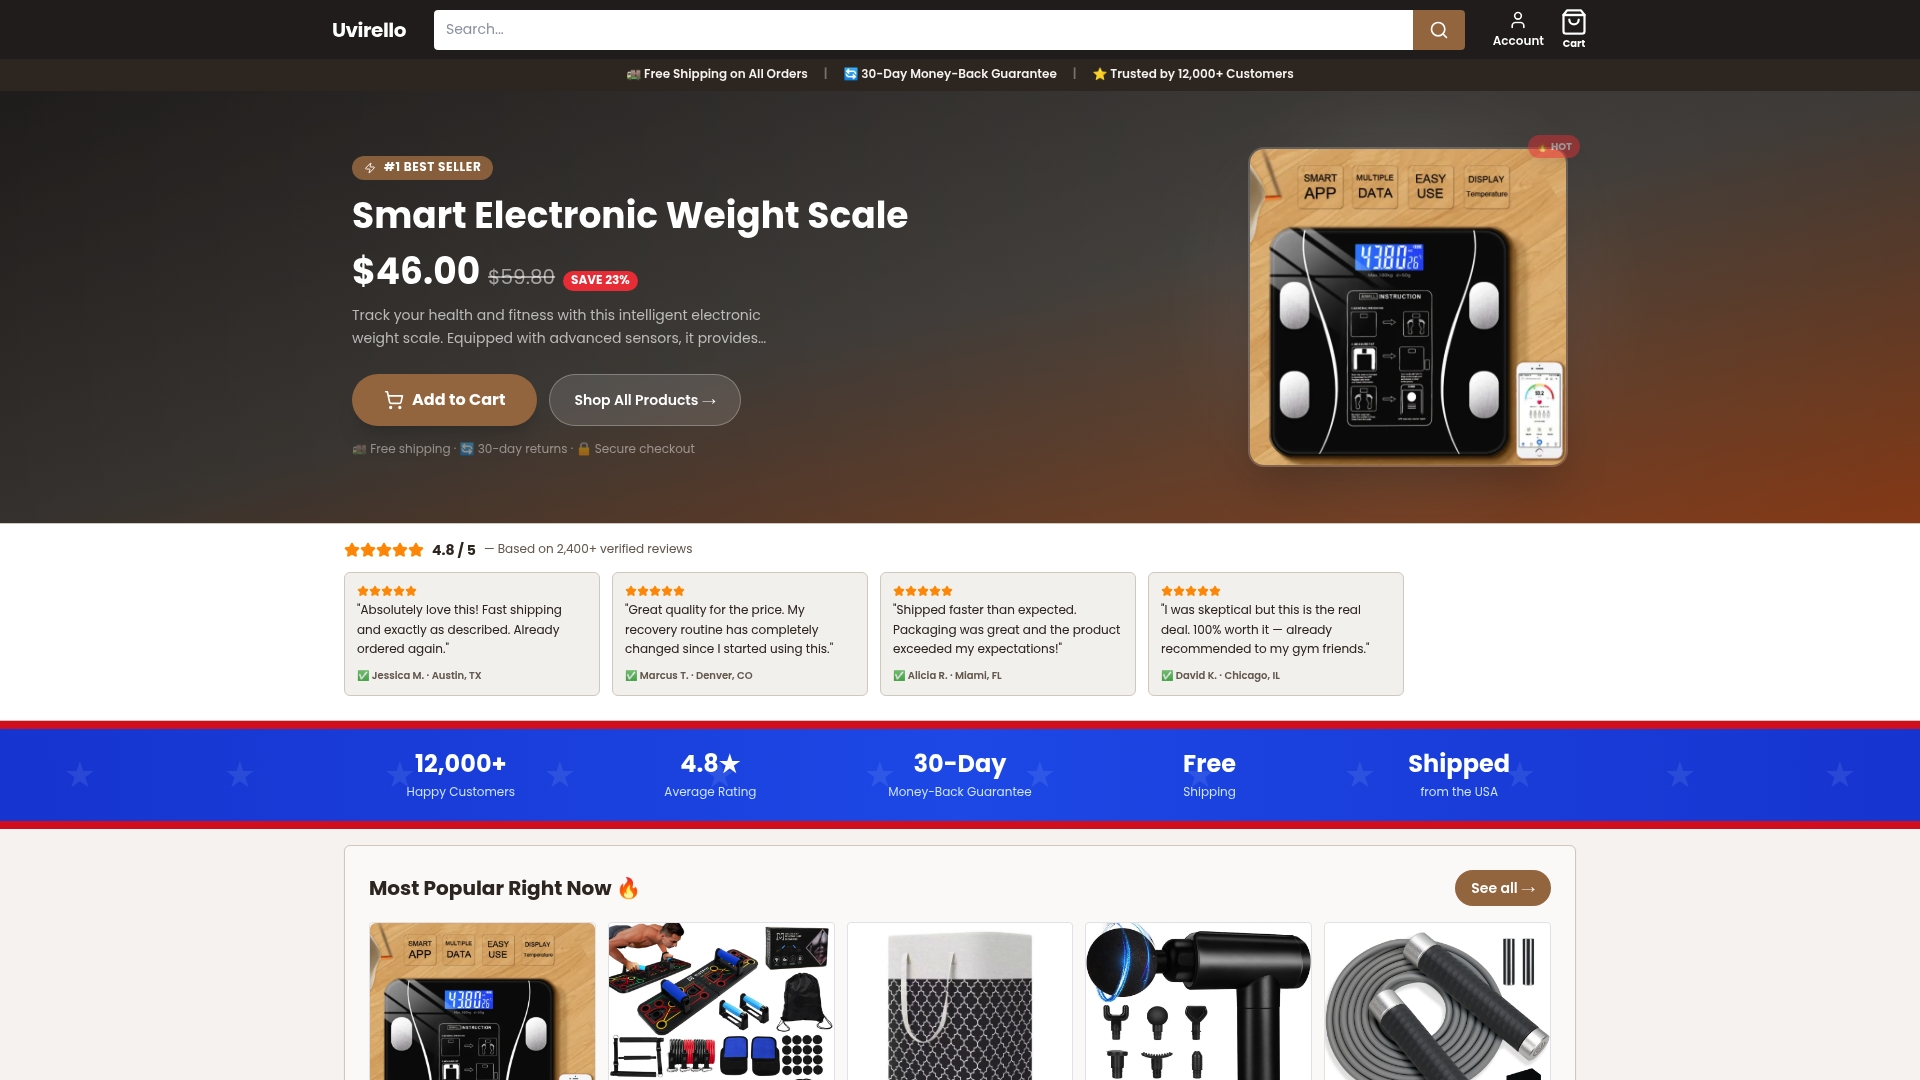
Uvirello's Smart Electronic Weight Scale is a practical first step for the anatome domain. It measures body fat percentage, BMI, and other body composition metrics with high-precision sensors, giving you clean, structured data from day one. Over 12,000 people have rated it 4.8 out of 5, making it one of the most trusted starting points for anyone building a personal health tracking system. Pair it with a wearable and an open-source dashboard, and you have the foundation of a real multi-domain setup running within a week.
FAQ
What is a holistic health tracking system?
A holistic health tracking system integrates data from multiple biological and environmental domains, including sleep, glucose, genetics, and air quality, into a single platform for continuous, personalized health monitoring.
How long does it take to set up a health tracking system?
Building a functional system with data ingestion pipelines, database setup, and AI configuration typically takes 5–10 hours for the initial setup.
What is the best way to track holistic health on a budget?
Hardware for a self-hosted system costs $50–$150 using a Raspberry Pi and sensors, while open-source software like PostgreSQL and Grafana costs nothing.
How does AI improve a health tracking system?
AI agents parse unstructured data like lab PDFs and notes, then answer natural language queries across your full health history, turning a passive log into interactive health intelligence.
How do I keep my health data private?
Use local-first storage or encrypted private cloud containers. Privacy-first architectures give you 100% data ownership and prevent third-party access to sensitive health records.