
Consumer visceral-fat readings are proxies, not measurements. They're built from indirect electrical signals run through population-based formulas, and peer-reviewed comparisons against CT and MRI show they can miss the mark by a wide margin for any one person. That doesn't make them worthless. Used the same way, at the same time, day after day, they're a genuinely useful trend signal. Used as a one-time diagnostic number, they're not.
TL;DR:
- Visceral fat scales based on bioelectrical impedance provide trend data over time but are unreliable for single-point clinical assessment due to wide margins of error.
- Variability in readings is heavily influenced by hydration, recent activity, menstrual cycles, and device-specific prediction formulas, which can cause significant fluctuations.
- Validation studies show low correlation and high variability when comparing consumer BIA devices to MRI or CT, especially for visceral fat measurement.
- Consistent measurement conditions and averaging readings over weeks improve the reliability of trend analysis more than relying on individual single measurements.
- For precise diagnostic purposes, imaging techniques like MRI or CT remain the gold standard, while scales and simple measurements are better suited for monitoring overall trends.
Table of Contents
- How Visceral Fat Scale Accuracy Actually Works: The BIA Explanation
- What the Research Says About Body Fat Scale Accuracy vs. DEXA, CT, and MRI
- Why Your Readings Bounce Around: The Real Drivers of Fat Scale Precision
- Getting Real Value From Visceral Fat Measurement: Trends Over Single Readings
- When You Need More Than a Scale: DEXA, CT, MRI, and Simple Measurements
- Who's Behind This Guide and What the Numbers Show
- An Editorial Take: Treat the Number as Feedback, Not a Verdict
- Get More Reliable Trend Data With the Uvirello Smart Electronic Weight Scale
- Sources
How Visceral Fat Scale Accuracy Actually Works: The BIA Explanation
Every consumer scale that spits out a visceral-fat number is using bioelectrical impedance analysis, or BIA. It's the same core technology whether you paid $30 or $300, and understanding it explains most of what goes wrong.
Here's the mechanism: the scale sends a tiny, imperceptible electrical current up through one foot and down through the other. Muscle and blood, which hold a lot of water, conduct that current easily. Fat resists it. The scale measures how much resistance it hits (impedance), and from that single number, it has to reconstruct your entire body composition.
That reconstruction is where things get complicated. A raw impedance reading doesn't say "you have this much visceral fat." It gets fed into a prediction equation, along with your height, weight, age, and sex, and that equation spits out an estimate calibrated against a reference population studied when the formula was built. If you don't resemble that reference group closely, whether in body shape, age, or muscle mass, the estimate drifts.
A few design choices explain why one scale gives you a different number than another:
- Single frequency vs. multi-frequency: cheaper devices send one current frequency through your body; higher-end models send several, which can better distinguish intracellular from extracellular fluid.
- Electrode layout: foot-to-foot scales only sense your lower body and extrapolate the rest; models with handgrips or abdominal pads sample more of the trunk directly.
- Prediction equation: even two scales with identical hardware can report different visceral-fat scores if their manufacturers used different formulas.
- Firmware updates: some brands quietly retune their algorithms, which is why your number can shift after a software update with no real change in your body.
None of these consumer devices are imaging your visceral fat. They're inferring it from an electrical proxy and a formula trained on somebody else's body, which is exactly why validation research comparing abdominal BIA devices to MRI finds a device can track total abdominal fat reasonably well while still missing the visceral-specific number by a wide margin.
What the Research Says About Body Fat Scale Accuracy vs. DEXA, CT, and MRI
This is where the science gets uncomfortable for anyone who trusts their scale's app to the decimal point.
A 2021 observational study published in JMIR mHealth and uHealth put three popular smart scales through their paces against reference measurements. The good news: weight accuracy was excellent, with a median absolute error under 1 kilogram. The bad news showed up as soon as the scales tried to estimate body composition. Fat-mass estimates were off by a median absolute error that was substantial and varied by device, and the errors weren't random noise scattered evenly around zero. They tended to run in a consistent direction, usually underestimating fat mass compared to the reference method.
The core problem in one number: validation research comparing single-frequency BIA against CT scans found correlation coefficients of only 0.39 to 0.64 for visceral fat, with classification sensitivity and specificity sitting in the mid-60s to 70s percent range.
A correlation of 0.64 sounds almost respectable until you translate it into practice. It means the scale is picking up a real signal, people with more visceral fat do tend to score higher, but the relationship is loose enough that any individual reading carries substantial uncertainty. Sensitivity and specificity in the 65 to 76 percent range means the device misclassifies a meaningful share of people when trying to flag elevated visceral fat; that error rate differs by sex, which is itself a clue about model bias.
A systematic review and meta-analysis pooling multiple validation studies found something even more specific: BIA systematically underestimates intra-abdominal adipose tissue, with wide limits of agreement, pooled mean difference of about −11.6 cm² against a 95% range spanning roughly −43.1 to 19.9 cm². The authors' conclusion was blunt: those limits of agreement are too wide to trust BIA for individual clinical or research-grade quantification of visceral fat.
That phrase, "limits of agreement," deserves unpacking because it's the statistical concept that actually explains why your scale can feel so unreliable one week to the next. Correlation tells you whether two measurements move in the same direction across a group of people. Agreement tells you whether one specific measurement can substitute for the other in one specific person. A Bland-Altman analysis comparing leg-to-leg BIA to CT found limits of agreement wide enough, often in the range of tens of percentage points, that a scale reading and a clinical scan on the same person, same day, can land far enough apart to change how a clinician would interpret the result.
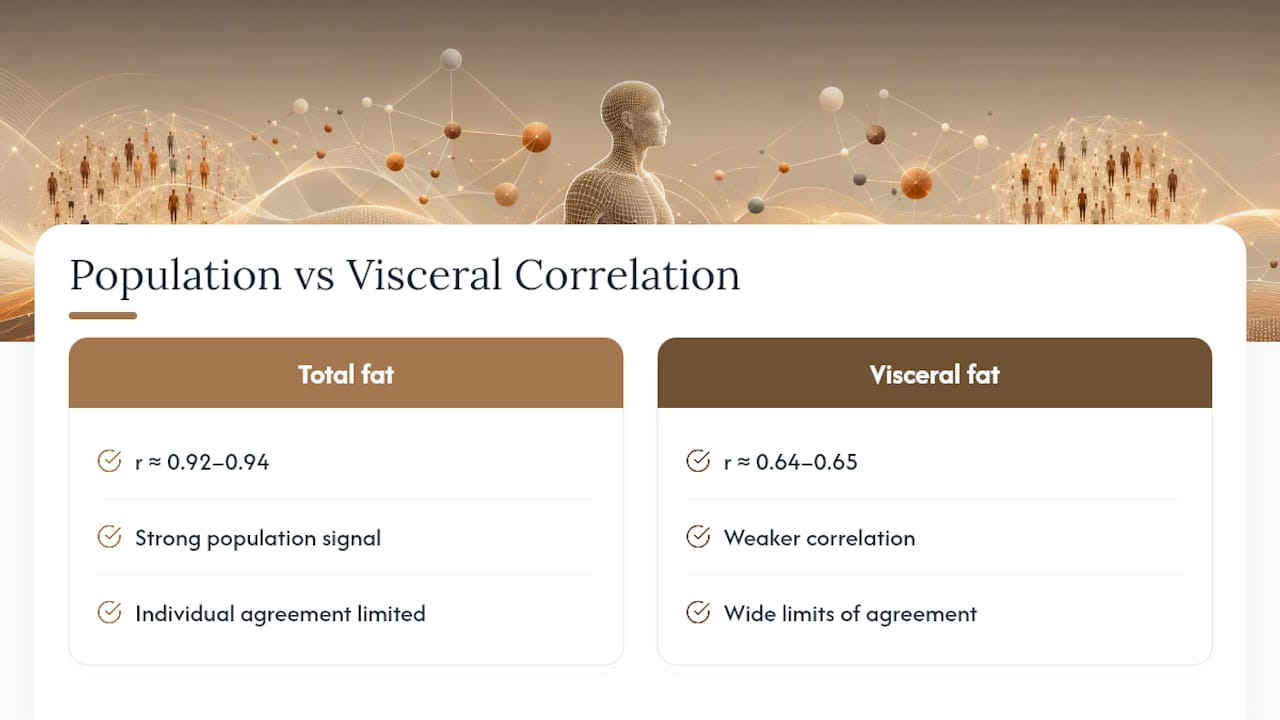
Put plainly: your scale can be strongly correlated with reality across a population and still be wrong enough about you specifically to make a poor stand-in for a scan. Some abdominal-specific BIA devices do better on this front. One validation study found a trunk-electrode device correlated well with MRI for total abdominal adipose tissue (r ≈ 0.92 to 0.94) but dropped to r ≈ 0.64 to 0.65 when isolating MRI-measured visceral adipose tissue specifically. Precision for the broad target doesn't guarantee validity for the narrow one.
The bottom line researchers keep landing on: consumer BIA scales are not built for single-point clinical decisions. They're built for something else entirely, watching a number move over weeks and months, and that's a different job with a much lower accuracy bar to clear.
Why Your Readings Bounce Around: The Real Drivers of Fat Scale Precision
If you've ever stepped on a scale twice in the same morning and gotten two different visceral-fat numbers, you've experienced the biggest practical problem with BIA: it's an electrical measurement, and electricity is sensitive to things that have nothing to do with your actual fat.
Physiological factors that shift your reading hour to hour:
- Hydration status. Water conducts electricity, so dehydration or overhydration can shift the impedance signal and swing your fat-percentage estimate by several points.
- Recent exercise. A workout increases blood flow to your extremities and can temporarily change conductivity.
- Alcohol. It affects hydration and blood flow simultaneously, which is why a reading taken the morning after drinking often runs high.
- A recent meal. Digestion redistributes fluid and can nudge the number, which is why most guidance favors a fasted, empty-bladder measurement.
- Menstrual cycle phase. Fluid retention shifts across the cycle and can produce real week-to-week swings that have nothing to do with fat gain or loss.
Demographic and model-related factors baked into the device itself:
Prediction equations are only as good as the population they were trained on. A formula built mostly around one BMI range, age bracket, or ethnicity will systematically misjudge people who fall outside it, a pattern researchers have flagged as a known source of device error variance. If you're at the edge of "average" for the group a scale's algorithm was calibrated on, whether that's a very muscular athlete or someone at a higher BMI, expect more drift.
Device and protocol factors:
Single-frequency, foot-to-foot scales are the least precise design; multi-frequency and segmental devices with trunk or handgrip electrodes generally do better, though they still rely on prediction equations and can be thrown off by fluid shifts or body-shape differences most models weren't built to handle.
A five-step checklist to cut avoidable noise:
- Weigh yourself at the same time of day, ideally first thing in the morning.
- Use the bathroom first. A full bladder measurably skews the impedance signal.
- Skip intense exercise for at least a couple of hours before stepping on.
- Stand barefoot, with dry, bare skin contacting the electrodes directly.
- Keep the scale on a hard, flat surface. Carpet can distort foot contact and readings.
Pro Tip: Log your readings for two full weeks before drawing any conclusion. A single day's number tells you almost nothing; a two-week average, taken under consistent conditions, filters out most of the daily noise and starts showing you something real.
Getting Real Value From Visceral Fat Measurement: Trends Over Single Readings
The fix for imprecise individual readings isn't a better scale. It's a better process.
A single measurement carries all the noise described above baked in. A weekly or biweekly moving average smooths that out, because random error in one direction on Monday tends to get offset by random error in the other direction by Thursday. What survives the averaging is the real signal: is this number actually trending up, down, or flat over time?
Practical logging looks like this: weigh in most days if you want dense data, but judge yourself only on the rolling average, never the daily point. A consistent app-connected measurement routine makes this dramatically easier to stick to than a mental tally or a paper log. Give any single change at least two to three weeks before treating it as meaningful, since day-to-day variation from hydration and food intake alone can swamp a smaller real shift.
Pairing your scale trend with wearable data and waist circumference adds a second, largely independent data point. Waist circumference doesn't rely on electrical modeling at all, just a tape measure, and it correlates well with abdominal fat distribution. When both are heading the same direction over a month, that's a far more trustworthy signal than either alone.
| Signal | What it's good for | What it can't tell you |
|---|---|---|
| Scale visceral-fat trend | Directional change over weeks/months | Your exact visceral-fat area or volume |
| Waist circumference | Independent check on abdominal fat distribution | Total body fat percentage |
| Fasting glucose / blood pressure | Metabolic risk context | Fat distribution itself |
Certain patterns are worth flagging to a doctor rather than just logging. A rapid, sustained rise in visceral-fat trend combined with rising waist circumference, elevated fasting glucose, or climbing blood pressure is a cluster of signals that points toward metabolic risk worth investigating properly, not just tracking at home. On its own, no single home number, scale or tape measure, should be the basis for a health scare or a health victory lap. Tracking body composition instead of weight alone gives you a fuller picture, but the picture is still directional, not diagnostic.
When You Need More Than a Scale: DEXA, CT, MRI, and Simple Measurements
Home scales occupy one end of a spectrum that runs from "free and instant" to "expensive and precise." Knowing where each option sits helps you pick the right tool for the actual question you're asking.
- CT and MRI remain the reference standards for visceral fat specifically. They image the fat directly rather than inferring it, which is why researchers use them to validate everything else. CT carries a radiation dose and meaningful cost; MRI avoids radiation but costs more and takes longer. Neither is something you do for routine tracking.
- DEXA (dual-energy X-ray absorptiometry) is faster and cheaper than MRI, delivers very low radiation exposure, and gives a reasonably reliable regional fat estimate, though its visceral-fat specific output is itself a modeled estimate rather than a direct volumetric measurement, so it sits a notch below CT/MRI in precision for that particular metric.
- Ultrasound can visualize abdominal fat layers directly and is radiation-free, but it's more operator-dependent and less standardized for visceral fat quantification than CT or MRI.
- Waist circumference and waist-to-height ratio cost nothing, take thirty seconds, and correlate meaningfully with abdominal fat distribution, without pretending to offer precision they can't deliver.
The tradeoff is straightforward: accuracy climbs as cost, radiation exposure (for CT), and access barriers climb with it. Nobody needs an MRI to track fitness progress. Reach for clinical imaging when there's genuine diagnostic uncertainty, when multiple risk factors are stacking up together, or when a clinician specifically needs a research-grade number rather than a trend line. For everyone else, a scale plus a tape measure plus basic labs covers the job well.
Who's Behind This Guide and What the Numbers Show
This piece was written by Jacob,, drawing on peer-reviewed validation research rather than manufacturer marketing claims.
Uvirello's own product data adds useful context to how these devices get used in practice:
- Over 12,000 customers have purchased and rated the Uvirello Smart Electronic Weight Scale, with an average rating of 4.8 out of 5.
- Users commonly report better consistency in their fitness routines once they start tracking composition trends rather than daily weight alone.
- The scale's sensors are intended for repeatable, consistent home measurement, not clinical-grade imaging.
To be direct about it: no scale, Uvirello's included, replaces a DEXA scan or an MRI when a genuine diagnostic question is on the table. What it does well is solve a different problem entirely, giving you a consistent, trackable number over time so you can see whether your habits are working.
An Editorial Take: Treat the Number as Feedback, Not a Verdict

The mistake I see people make isn't trusting their scale too little. It's trusting one single reading too much. A visceral-fat number that ticks up by one point after a salty dinner isn't a health crisis, and one that drops after a hard workout and a sauna session isn't a victory. Both are noise dressed up as signal.
What actually works is treating the number the way a coach treats a stopwatch: not proof of anything on its own, but useful feedback for adjusting behavior. Log it consistently, average it out, and pair it with something independent like long-term wellness trend monitoring or a tape measure. If the trend moves in a worrying direction alongside other risk factors, that's when a conversation with a doctor, not another look at the app, is the right next step.
— Jacob
Get More Reliable Trend Data With the Uvirello Smart Electronic Weight Scale
If consistency is what actually makes a visceral-fat trend meaningful, Uvirello is built around solving exactly that problem. The Smart Electronic Weight Scale uses sensors and syncs every reading to a companion app, so instead of scattered numbers on a bathroom floor, you get a running log that's easier to average and interpret over weeks, not just days.
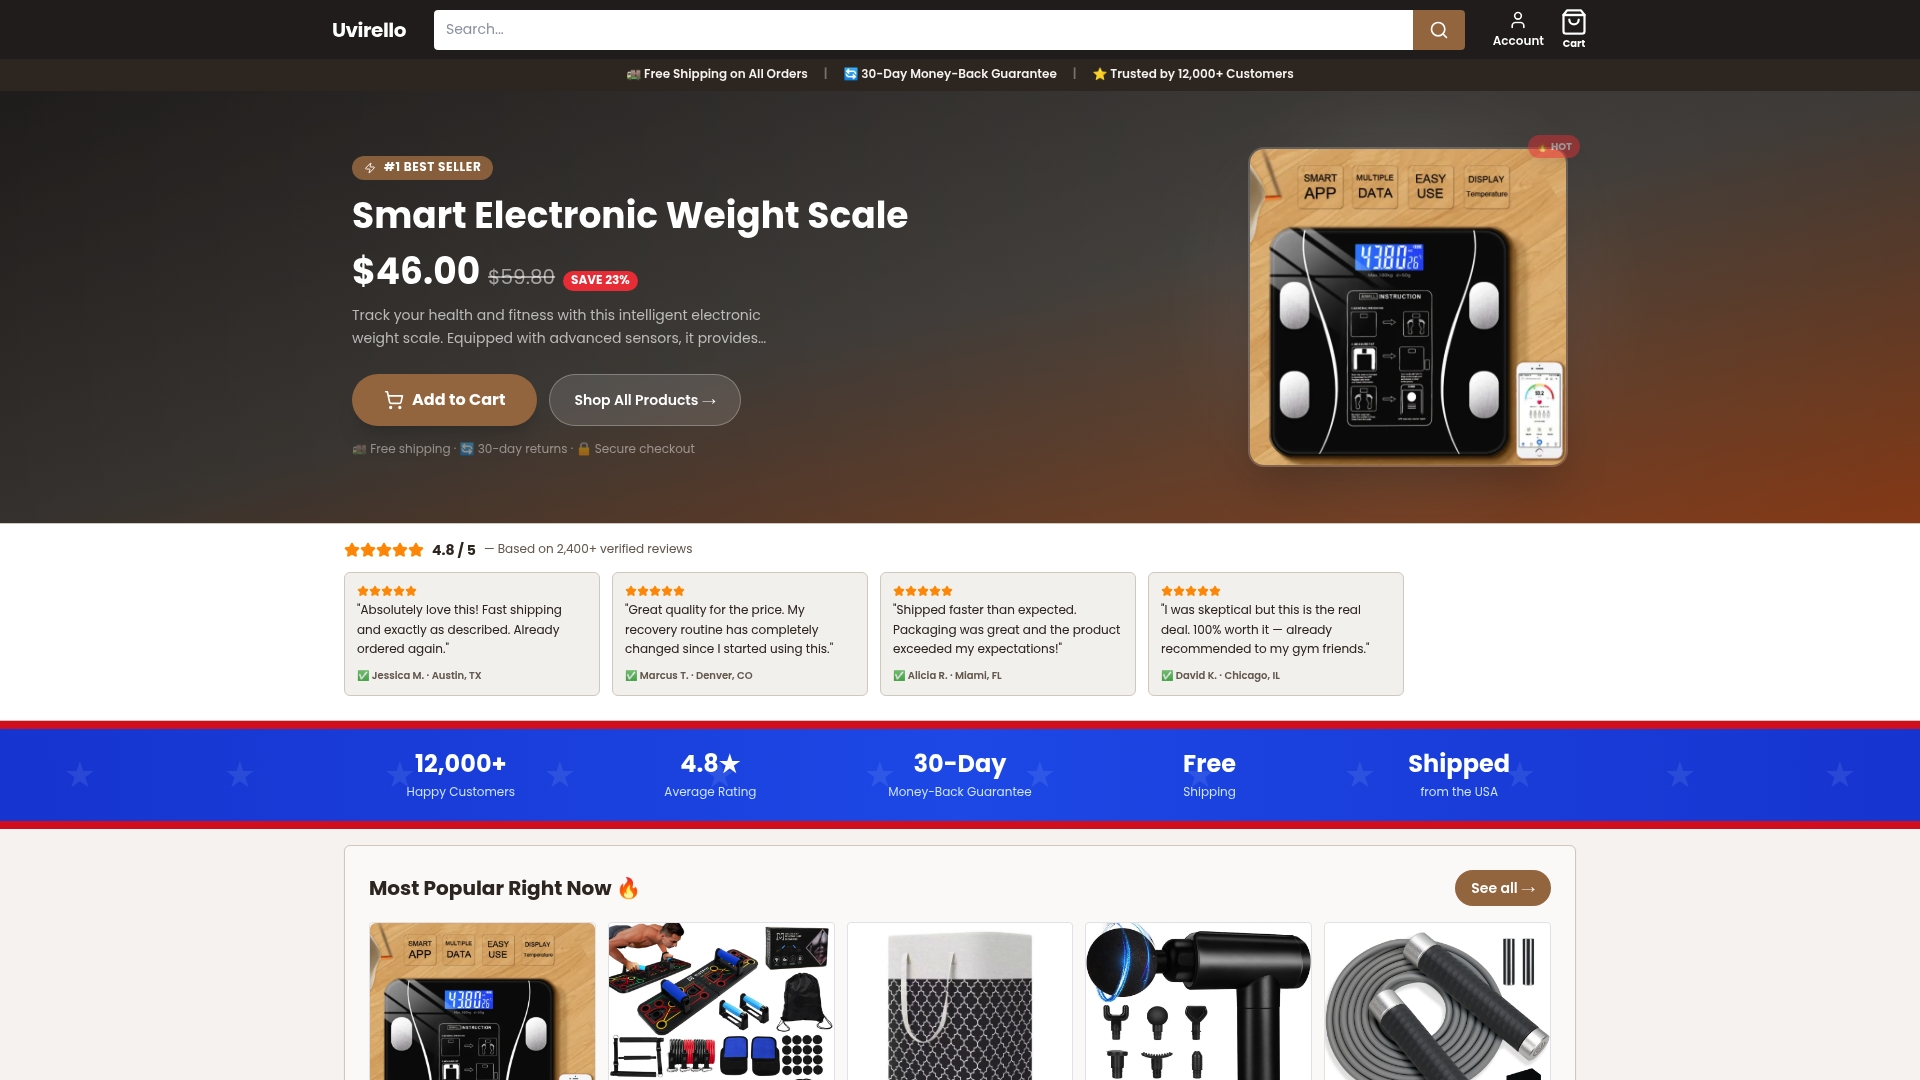
It supports multiple user profiles, which matters if more than one person in your household is tracking their own composition trend separately, and its app connectivity makes the kind of rolling-average approach this article recommends something you can actually stick to, instead of a spreadsheet you abandon after a week. Over 12,000 buyers have rated it 4.8 out of 5, many citing better follow-through on their fitness routines once they had consistent data in front of them.
If you're ready to start building a real trend line instead of chasing single-day numbers, check out the Uvirello Smart Electronic Weight Scale and see the full specs and current offers.
Sources
- Measurement of visceral fat and abdominal obesity by single-frequency bioelectrical impedance and CT: a cross-sectional study
- Intra-Abdominal Adipose Tissue Quantification by Alternative Versus Reference Methods: A Systematic Review and Meta-Analysis
- Validity of a New Abdominal Bioelectrical Impedance Device to Measure Abdominal and Visceral Fat: Comparison With MRI
This article is general information, not a substitute for advice from a qualified doctor. Consult a qualified healthcare professional about your own circumstances before acting on anything here.