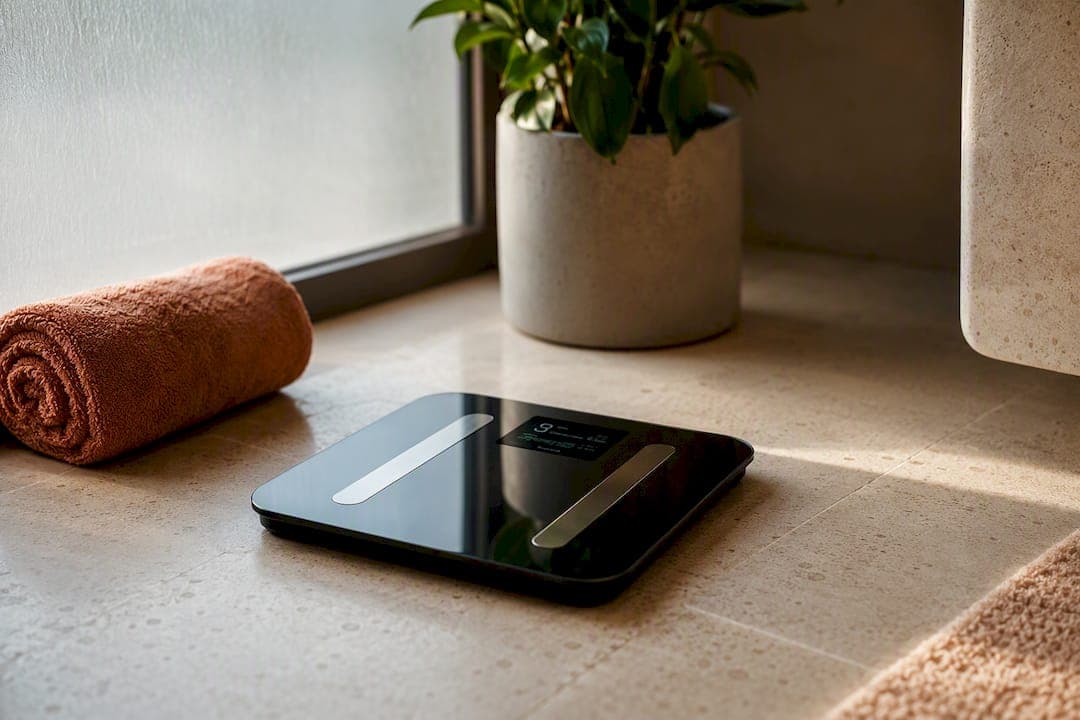
On a consumer smart scale, bone mass is an estimate of your skeletal mineral weight, calculated using bioelectrical impedance analysis (BIA), not a direct measurement. Most adult women see readings somewhere around 1.8 to 2.5 kg, and most adult men land closer to 2.5 to 3.5 kg, though the exact number shifts depending on the device and its algorithm. These are practitioner-reported ballpark ranges, not fixed targets, since device-to-device variance is real and expected.
The single best use for this number: track it over weeks and months, not days.
A single reading tells you almost nothing on its own. The trend line does.
- Bone mass on your scale = estimated skeletal mineral weight, not a diagnostic figure
- Typical ranges: about 1.8–2.5 kg for women, 2.5–3.5 kg for men
- Use it primarily for observing trends over time rather than making clinical judgments
Key Takeaways
Bone mass on a smart scale is a BIA-derived trend indicator, not a diagnostic number, and it's most useful when read as a monthly average rather than a daily score.
| Point | Details |
|---|---|
| Know your ballpark range | Women typically see about 1.8–2.5 kg, men about 2.5–3.5 kg, with device-to-device variance built in. |
| Ignore single-day swings | Device accuracy runs around ±0.5–1 lb, so small daily moves are usually just noise. |
| Watch hydration timing | Weigh in at the same time of day to reduce impedance-driven fluctuation in your readings. |
| Track monthly, not daily | Log weekly readings and compare monthly averages to spot a real, sustained trend. |
| Use a consistent device | Uvirello's Smart Electronic Weight Scale combines high-precision sensors with app logging to make month-to-month trend tracking practical at home. |
Table of Contents
- Bone Mass Normal Range and How Smart Scales Actually Calculate It
- What Numbers Are Normal, and How Do You Read Them?
- Why Your Reading Moves: Hydration, Algorithms, and Device Limits
- How to Track Bone Mass Without Chasing Noise
- Building Habits That Actually Support Bone Health
- Where the Scale Ends and Real Bone Health Begins
- Track Bone Mass Trends With Uvirello's Smart Scale
- Sources
Bone Mass Normal Range and How Smart Scales Actually Calculate It
Your scale doesn't scan your skeleton. It runs a weak electrical current through your body and measures resistance, then plugs that number into an algorithm along with your weight, height, age, and sex to estimate body composition, including bone mass. This is the same BIA technology behind body fat and muscle mass readings, and it's why the number can shift when your inputs (like a new weight) change even slightly.
Here's what that means in practice for anyone chasing a bone mass normal range on a home device:
- It's a modeled estimate, not a scan. The scale infers skeletal mineral weight from impedance and demographic data, it doesn't image or measure bone tissue directly.
- It's a secondary metric. Compared to weight or body fat percentage, bone mass carries less clinical weight and more everyday context.
- It rewards patience. Because the underlying algorithm updates slowly, this number is far more useful as a multi-month trend line than a daily checkpoint.
Consumer-device accuracy for bone mass typically runs around ±0.5 to 1 pound, which sounds small until you realize that's the entire range most people's readings move in over a year.
What Numbers Are Normal, and How Do You Read Them?
The ranges most people encounter cluster tightly: women commonly see 1.8 to 2.5 kg, men commonly see 2.5 to 3.5 kg. Some scales display bone mass as a percentage of total body weight instead of an absolute figure, which can make small shifts look more dramatic than they are.
Here's the part that trips people up: a change of half a pound to a full pound is often just noise, not a real shift.
Statistic to remember: Consumer BIA scales report bone-mass estimates with a typical accuracy window of ±0.5 to 1 pound, meaning a reading that bounces within that range from one weigh-in to the next isn't telling you anything changed.
What actually counts as a meaningful signal:
- A sustained shift across several weeks or months, not a single day-to-day jump
- A change that holds steady across multiple readings taken under similar conditions
- A trend that lines up with a real change in training volume, body weight, or diet
If your number moves from 2.1 kg to 2.0 kg one morning and back to 2.2 kg the next week, that's the device's normal wobble. If it drifts from 2.1 kg down to 1.7 kg over three months with no other explanation, that's worth paying attention to and possibly discussing with a doctor.
Why Your Reading Moves: Hydration, Algorithms, and Device Limits
Bone mass estimates are impedance math, and impedance is extremely sensitive to how much water is in your body at the moment you step on the scale. Drink a large glass of water, work out, or wake up dehydrated, and your hydration status alone can shift the number your scale reports, even though nothing about your actual bone health changed overnight.

That sensitivity is exactly why researchers treat BIA-derived bone estimates with more caution than other body composition metrics. Comparative studies measuring BIA against reference lab methods find correlation coefficients around r ≈ 0.425 to 0.829 for bone mineral content, with wide limits of agreement. That's a meaningfully weaker relationship than lean mass measurements typically show on the same devices, which often correlate above r = 0.9. No consumer scale measures bone directly, and multi-frequency models tend to perform better than single-frequency ones, but none of them replace a clinical scan.
Statistic to remember: Reported bone mineral content correlations for BIA devices range from roughly r = 0.425 to 0.829 against reference methods, a wide enough spread that any single reading deserves skepticism.
Practical takeaways for anyone watching their numbers week to week:
- Hydration swings, not skeletal changes, explain most day-to-day movement
- Multi-frequency devices generally track more consistently than basic single-frequency models
- Expect your bone mass reading to stay flat for months at a stretch, that's normal behavior for this metric, not a sign the scale is broken
Pro Tip: Weigh yourself at the same time of day, ideally right after waking and before eating or drinking, so hydration stays as consistent as possible between readings.
How to Track Bone Mass Without Chasing Noise
A reliable routine beats a sensitive scale every time. Here's a simple approach that filters out the noise and surfaces real trends:
- Pick a consistent time. Morning, post-bathroom, pre-breakfast tends to minimize hydration swings.
- Weigh in weekly to biweekly. Daily measurements mostly capture water fluctuation, not real change.
- Log everything in one place. Whether that's your scale's app or a simple spreadsheet, plot monthly averages instead of scanning single data points.
- Read bone mass alongside muscle mass and body fat. A drop in bone mass paired with a drop in muscle mass often points to overall weight loss, not a skeletal issue specifically.
- Flag sustained declines. If your monthly average trends downward for two or three consecutive months, or you notice symptoms like joint pain or fractures from minor impacts, that's worth a conversation with a doctor.
This kind of long-term trend monitoring is where smart scales genuinely earn their keep, and it's also why tracking full body composition beats fixating on the number on the scale alone.
Building Habits That Actually Support Bone Health
The scale can tell you a trend is happening. It can't tell you why, and it definitely won't fix anything on its own. What moves the needle over time is training and nutrition, the same two levers that have supported skeletal health for as long as anyone's been studying it.
- Lift and load your bones regularly. Two to three resistance training sessions per week, plus brisk walking or running intervals, gives bone tissue the mechanical stress it needs to stay dense.
- Get enough calcium and vitamin D daily. Fitness and health guidance consistently points to these two as the primary nutritional supports for bone health, well ahead of any scale-based intervention.
- Log your habits next to your scale data. Pairing dietary consistency with your weekly readings makes it far easier to spot what's actually driving a trend.
- Cover the basics. Adequate sleep, moderate alcohol intake, and staying away from cigarettes all support skeletal health in ways no amount of scale-watching can replace.
Pro Tip: If you're increasing resistance training intensity, expect muscle mass to shift faster than bone mass, the skeleton adapts on a much longer timeline than muscle tissue does.
Where the Scale Ends and Real Bone Health Begins
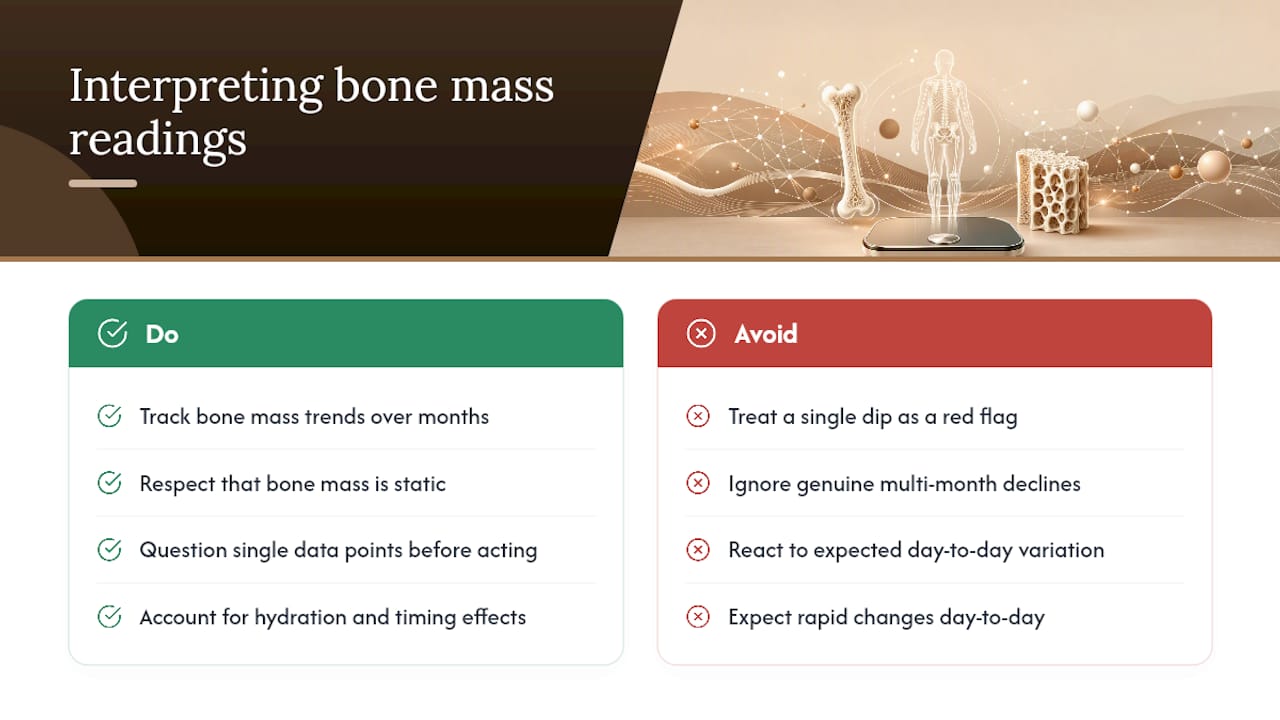
Most guides treat bone mass like it deserves the same scrutiny as body fat percentage. It doesn't, and pretending otherwise sets people up for false alarm or false comfort. The honest read is that this number is a low-resolution trend indicator riding on top of a hydration-sensitive measurement, and its real value shows up over months, not days.
What people consistently underestimate is how static this metric is supposed to be. If your bone mass reading hasn't budged in three months, that's not the device failing you, that's the expected behavior of a metric built on slow-moving physiology. The mistake I see most often is treating a single dip as a red flag when it's almost always hydration or measurement timing. The opposite mistake, ignoring a genuine multi-month decline because "it's just an estimate," is just as costly. Respect the trend, question the single data point, and you'll get more real signal out of this metric than most people ever do.
— Jacob
Track Bone Mass Trends With Uvirello's Smart Scale
A number that's only useful as a trend needs a device built for consistent, repeatable readings, not just a one-time snapshot. The Uvirello Smart Electronic Weight Scale pairs high-precision sensors with app-based logging, so your weekly weigh-ins land in one place automatically instead of scattered across sticky notes or memory.
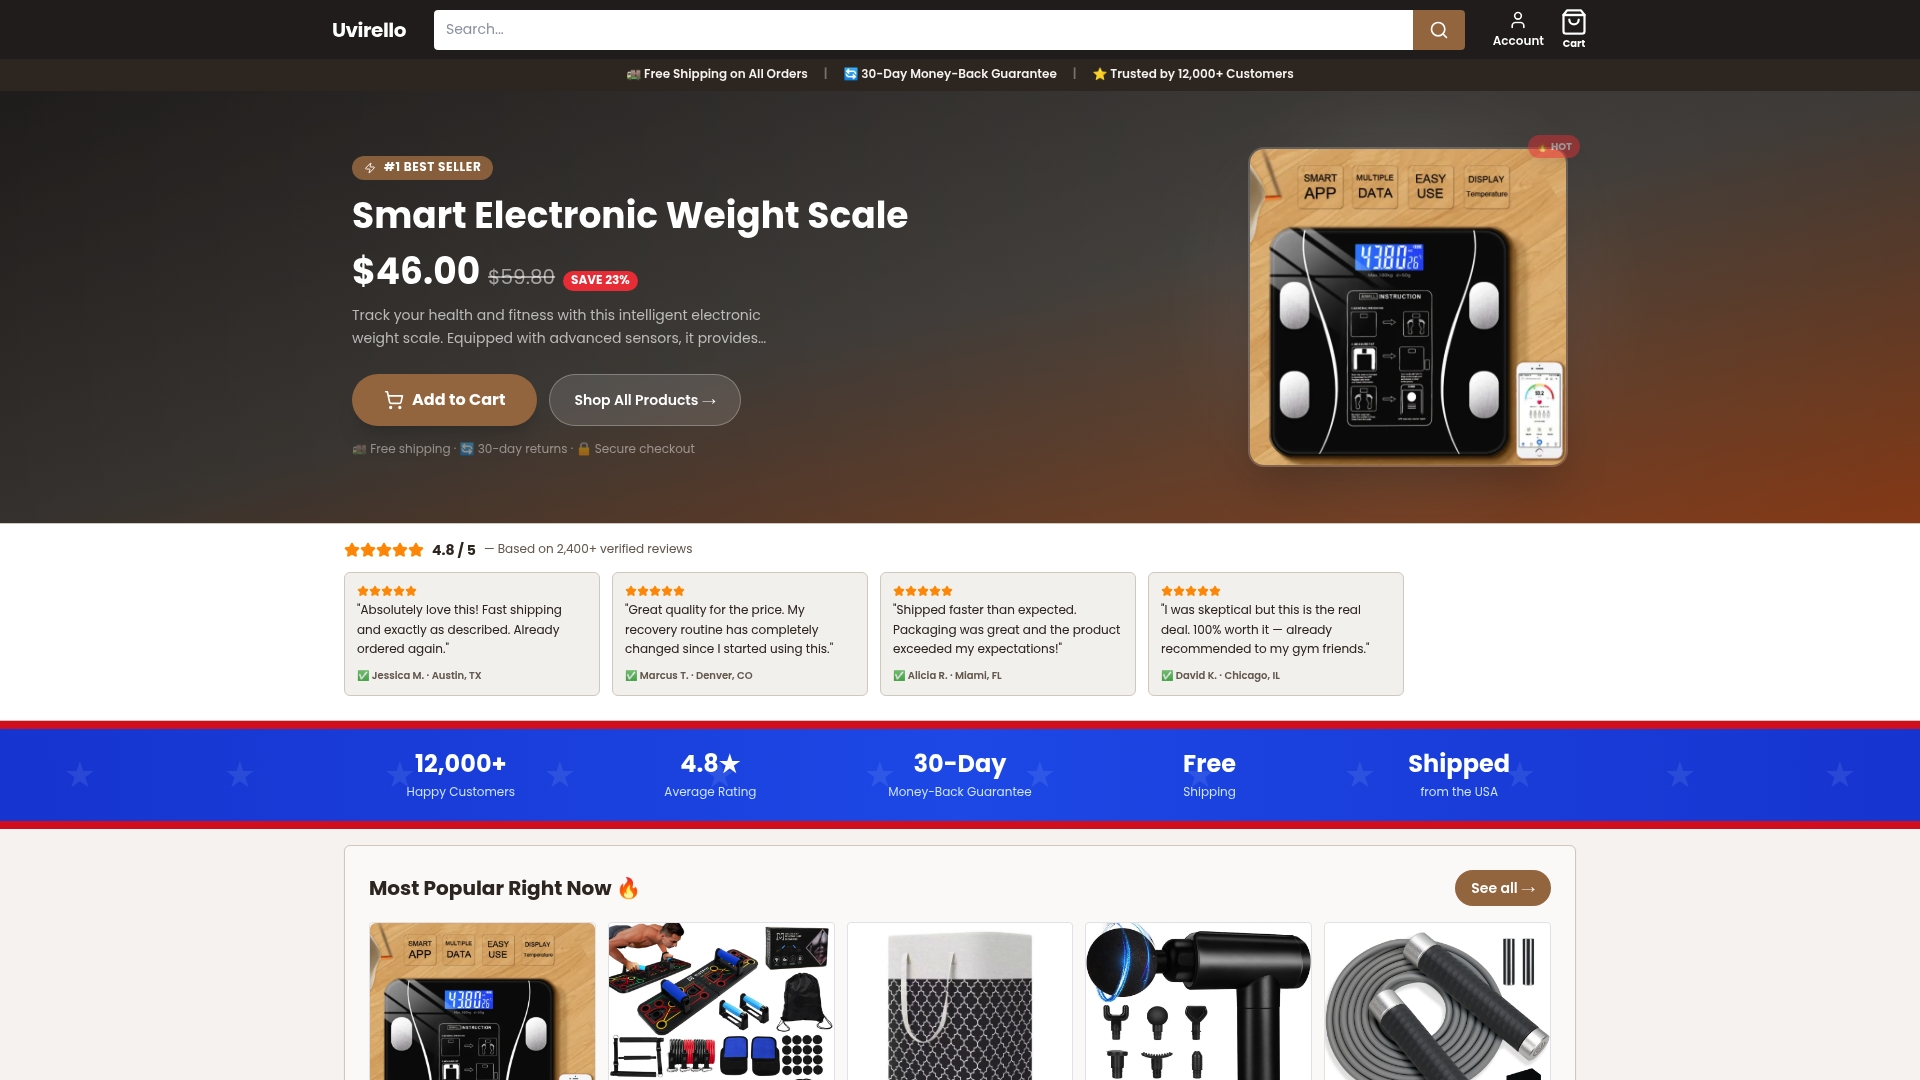
That consistency is exactly what the tracking routine above depends on. Rather than eyeballing a single reading and wondering if it means anything, the companion app plots your data over time, making it easy to spot a real multi-month shift versus normal noise. If you want deeper background on how these metrics get calculated, Uvirello's guide to body composition walks through it in more detail, and readers looking to connect their scale data to daily nutrition can check out the bone density tracking guide for practical next steps. Ready to start logging your own trend? Order your Uvirello scale and get your first baseline reading this week.
Sources
- Body Composition Metrics (2026): Physician-Reviewed Reference Ranges & Guide
- Guide to the Parameters Measured by Professional Scales - Dr. Petrache
- International Journal of Environmental Research and Public Health study on BIA vs reference methods
- PMC article on BIA and hydration effects