A home-based chronic disease risk assessment, in the context of a smart scale, is the practice of using body-composition measurements — BMI, body-fat percentage, estimated visceral fat, weight trends, and estimated resting metabolic rate (RMR) — to screen for early cardiometabolic risk signals. It is not a diagnosis. Think of it as a personal early-warning system you check weekly, not a clinical verdict you act on after a single reading.
The best use: track trends over weeks, not individual numbers on any given morning.
Key metrics your smart scale reports:
- BMI — a weight-to-height ratio used as a population screening tool
- Body-fat percentage — estimated via bioelectrical impedance analysis (BIA)
- Visceral-fat estimate — an algorithm-derived proxy for abdominal organ fat
- Weight trend — the direction of change over 4–8 weeks
- Estimated RMR — a rough calorie-burn baseline for planning purposes
Pro Tip: Never make a lifestyle decision based on one reading. A single high body-fat number after a salty dinner or a hard workout is noise, not signal. Wait for a two-week trend before adjusting anything.
Table of Contents
- What does each smart-scale metric actually measure?
- How accurate are smart scales compared to clinical standards?
- How to measure consistently for the best trend data
- Which extra home measurements sharpen your risk picture?
- Practical steps to lower your cardiometabolic risk starting today
- Key Takeaways
- Why the "just check your BMI" advice misses the point
- The Uvirello Smart Electronic Weight Scale fits this workflow
- Useful sources
What does each smart-scale metric actually measure?
Smart scales report several numbers, and each one carries a different level of clinical meaning.
BMI is calculated as weight in kilograms divided by height in meters squared. According to NCBI's review of BMI science, it is a screening tool, not a direct measure of body fat or its distribution. A muscular person can register as "overweight" while carrying very little fat. A sedentary person with low muscle mass can land in the "normal" range while carrying metabolically risky fat. BMI is useful for population-level screening; for individuals, it needs context.
Body-fat percentage is where BIA-based scales try to add nuance. The scale sends a low-level electrical current through your body and estimates fat mass based on how quickly the signal travels. Lean tissue conducts faster than fat. This can be more informative than BMI alone, particularly for people with high muscle mass or those who are "skinny-fat" — normal weight but high fat relative to lean mass. Research published in the Annals of Internal Medicine found that both low BMI and high DXA-derived body fat independently associated with increased mortality, which suggests these two metrics carry separate signals worth tracking.
Visceral-fat estimate is the most algorithmically uncertain number on your readout. The scale cannot directly see your abdominal organs. It infers visceral fat from total impedance, body weight, age, and sex. Treat it as a rough directional indicator, not a precise measurement.
Weight trend and estimated RMR round out the picture. A consistent downward or upward weight trend over four or more weeks is meaningful. RMR estimates from smart scales can actually outperform the Harris-Benedict equation for some users, though they vary by model. For a deeper look at body composition metrics explained, Uvirello's reference guide covers each output in detail.
| Metric | What it estimates | Clinical relevance |
|---|---|---|
| BMI | Weight relative to height | Obesity screening; not fat-specific |
| Body-fat % | Fat mass as share of total body weight | Metabolic risk, especially with normal BMI |
| Visceral-fat estimate | Abdominal organ fat (indirect) | Cardiometabolic risk proxy |
| Weight trend | Direction of change over weeks | Behavioral feedback signal |
| Estimated RMR | Daily calorie burn at rest | Nutrition planning baseline |
How accurate are smart scales compared to clinical standards?
Smart scales are reliable for one thing: total body weight. For body composition, the picture is messier.
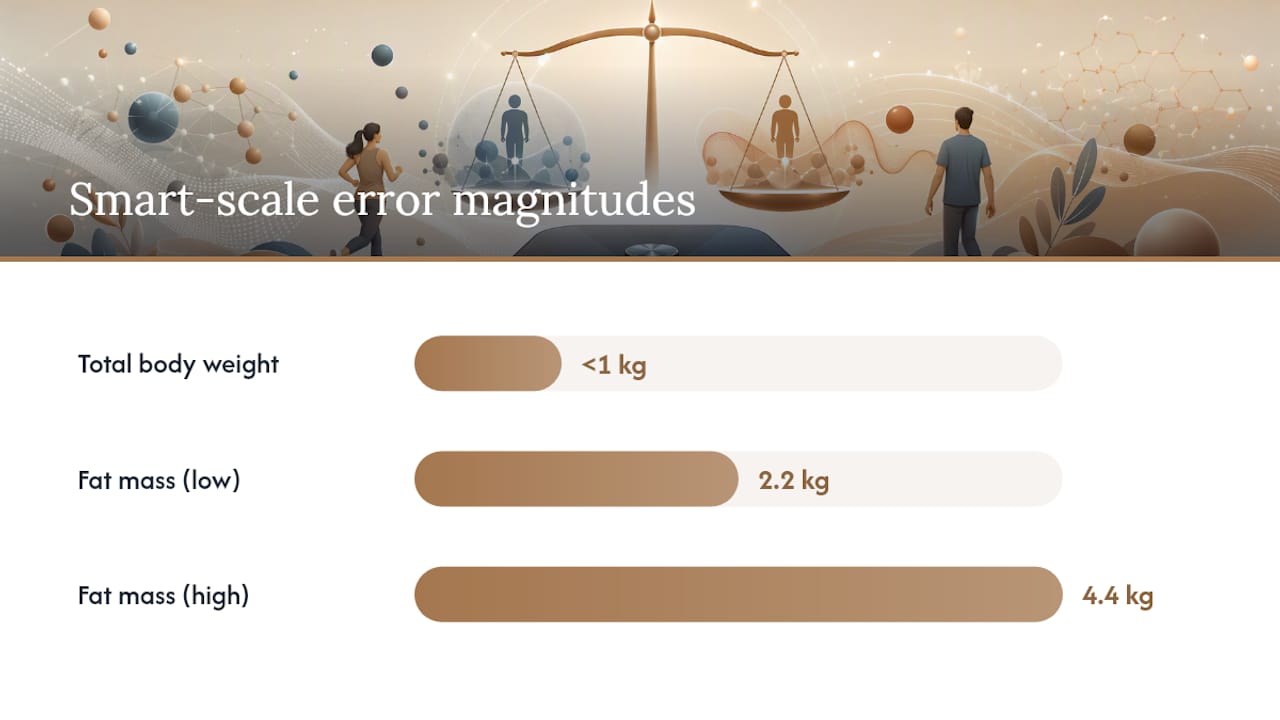
A 2021 JMIR mHealth study comparing three smart scales against DEXA found median absolute weight errors were small and generally less than one kilogram — essentially negligible. Fat-mass errors varied widely and could be several kilograms depending on the device and individual. A 2017 ACSM study found that commercial BIA scales tend to underestimate percent body fat to a variable and potentially clinically meaningful degree compared to DXA. That is a wide band.
| Measurement | Smart scale vs. DEXA accuracy |
|---|---|
| Total body weight | High (error under 1 kg) |
| Fat mass | Moderate to low (error ~2.2–4.4 kg absolute) |
| Lean/muscle mass | Variable; often overestimated |
| Visceral fat | Low; algorithm-dependent |
Common error sources include hydration status, recent exercise, recent meals, alcohol consumption, and bladder fullness. The PMC study on home BIA competency documented frequent protocol failures — people stepping on the scale after exercise or without voiding — that produced meaningfully skewed readings. Algorithmic bias is another real factor: scales are trained on specific population cohorts, and JMIR's accuracy data shows they perform better when the user matches that cohort in age, sex, ethnicity, and body type.
Pro Tip: Always use the same scale, the same app account, and the same settings. Relative change tracked on one device is far more reliable than comparing readings across two different scales.
How to measure consistently for the best trend data
Consistency beats precision here. Follow this protocol every time:
- Measure first thing in the morning, after waking.
- Void your bladder before stepping on.
- Do not eat or drink anything beforehand.
- Avoid exercise, caffeine, and alcohol for at least 12 hours prior.
- Stand barefoot, feet centered on the sensors, still for the full reading.
- Take two successive readings and average them if they differ by more than 0.5 lb.
- Log the result in the same app every time.
The PMC BIA protocol research specifically recommends voiding and avoiding exercise as the two most commonly skipped steps. Skipping either one can shift body-fat readings by several percentage points. Pairing your measurement habit with a productivity schedule makes consistency easier to maintain.
Pro Tip: Morning-after-bathroom is your baseline. Any other time of day introduces variables you cannot control.
Which extra home measurements sharpen your risk picture?
Smart-scale data alone covers maybe 60% of what you need for a meaningful cardiometabolic screen. These three additions cost nothing and take under five minutes.
- Waist-to-hip ratio (WHR): — Divide waist measurement by hip measurement. A WHR above 0.90 for men or 0.85 for women signals elevated abdominal adiposity risk per World Health Organization thresholds.
Combining these with scale data gives you a holistic health tracking picture that no single metric can provide on its own.
Pro Tip: Measure waist circumference the same morning as your scale reading. Both numbers together tell a story neither tells alone.
Practical steps to lower your cardiometabolic risk starting today
Tracking is only useful if it drives behavior. These steps produce measurable changes in the metrics your scale reports.
- Add two to three resistance-training sessions per week to preserve or build lean mass, which raises RMR and improves insulin sensitivity.
- Target 150 minutes of moderate aerobic activity weekly, per CDC guidelines, to reduce visceral fat over time.
- Aim for 0.7–1.0 grams of protein per pound of body weight daily to support lean mass during any calorie deficit.
- Sleep 7–9 hours per night. Sleep deprivation elevates cortisol, which promotes visceral fat accumulation and skews BIA readings.
- Drink enough water to keep urine pale yellow. Chronic mild dehydration inflates body-fat readings on BIA scales.
- Set a waist-circumference goal alongside a weight goal. Waist reduction is often a faster and more motivating signal than scale weight.
Tracking fitness metrics beyond weight — strength gains, resting heart rate, aerobic capacity — gives you additional feedback loops that scale data alone cannot provide.
Pro Tip: Pair your weekly scale check with a calendar habit: every Sunday morning, log weight, body-fat %, and waist circumference. Four weeks of that data is worth more than a year of sporadic readings.
Key Takeaways
Smart scales are reliable trend-tracking tools for cardiometabolic risk screening, but body-fat accuracy varies by 2–11 percentage points versus DEXA, so consistent protocol and complementary measures matter as much as the device itself.
| Point | Details |
|---|---|
| Smart scales measure trends, not diagnoses | Use four-to-eight-week trends to assess risk; never act on a single reading. |
| Body-fat error vs. DEXA is real | Fat-mass readings can be underestimated by 2–11 percentage points compared to DEXA; weight readings are far more accurate. |
| Waist circumference adds critical context | Over 40 inches (men) or 35 inches (women) signals elevated metabolic risk independent of BMI. |
| BMI ≥30 triggers a clinical workup | A fasting lipid panel, glucose, HbA1c, and thyroid tests are the standard next steps per StatPearls. |
| Uvirello's Smart Electronic Weight Scale | Tracks body-fat %, BMI, and weight trends with high-precision sensors, rated 4.8/5 by over 12,000 customers. |
Why the "just check your BMI" advice misses the point
Most people who buy a smart scale expect it to tell them whether they are healthy. That expectation is both understandable and slightly off. BMI is a population tool that was never designed to assess an individual's metabolic risk with precision. Body-fat percentage from BIA is more informative for many people, but it carries its own error range. Neither number, alone, is the answer.
What actually matters is the pattern over time, combined with the measurements that a scale cannot take: waist circumference, blood pressure, and basic labs. The scale is the easiest part of the workflow to automate. The harder part is building the habit of pairing it with those other measures and knowing when the combined picture warrants a clinician's attention.
The chronic disease risk evaluation framework described in this article is not about achieving a perfect number. It is about catching a trend early enough that you have real options. A scale that shows a slow, consistent increase in body-fat percentage over three months, paired with a waist circumference creeping past threshold, is telling you something worth acting on before it becomes a fasting glucose problem.
That is what home-based chronic condition risk analysis is actually for.
The Uvirello Smart Electronic Weight Scale fits this workflow
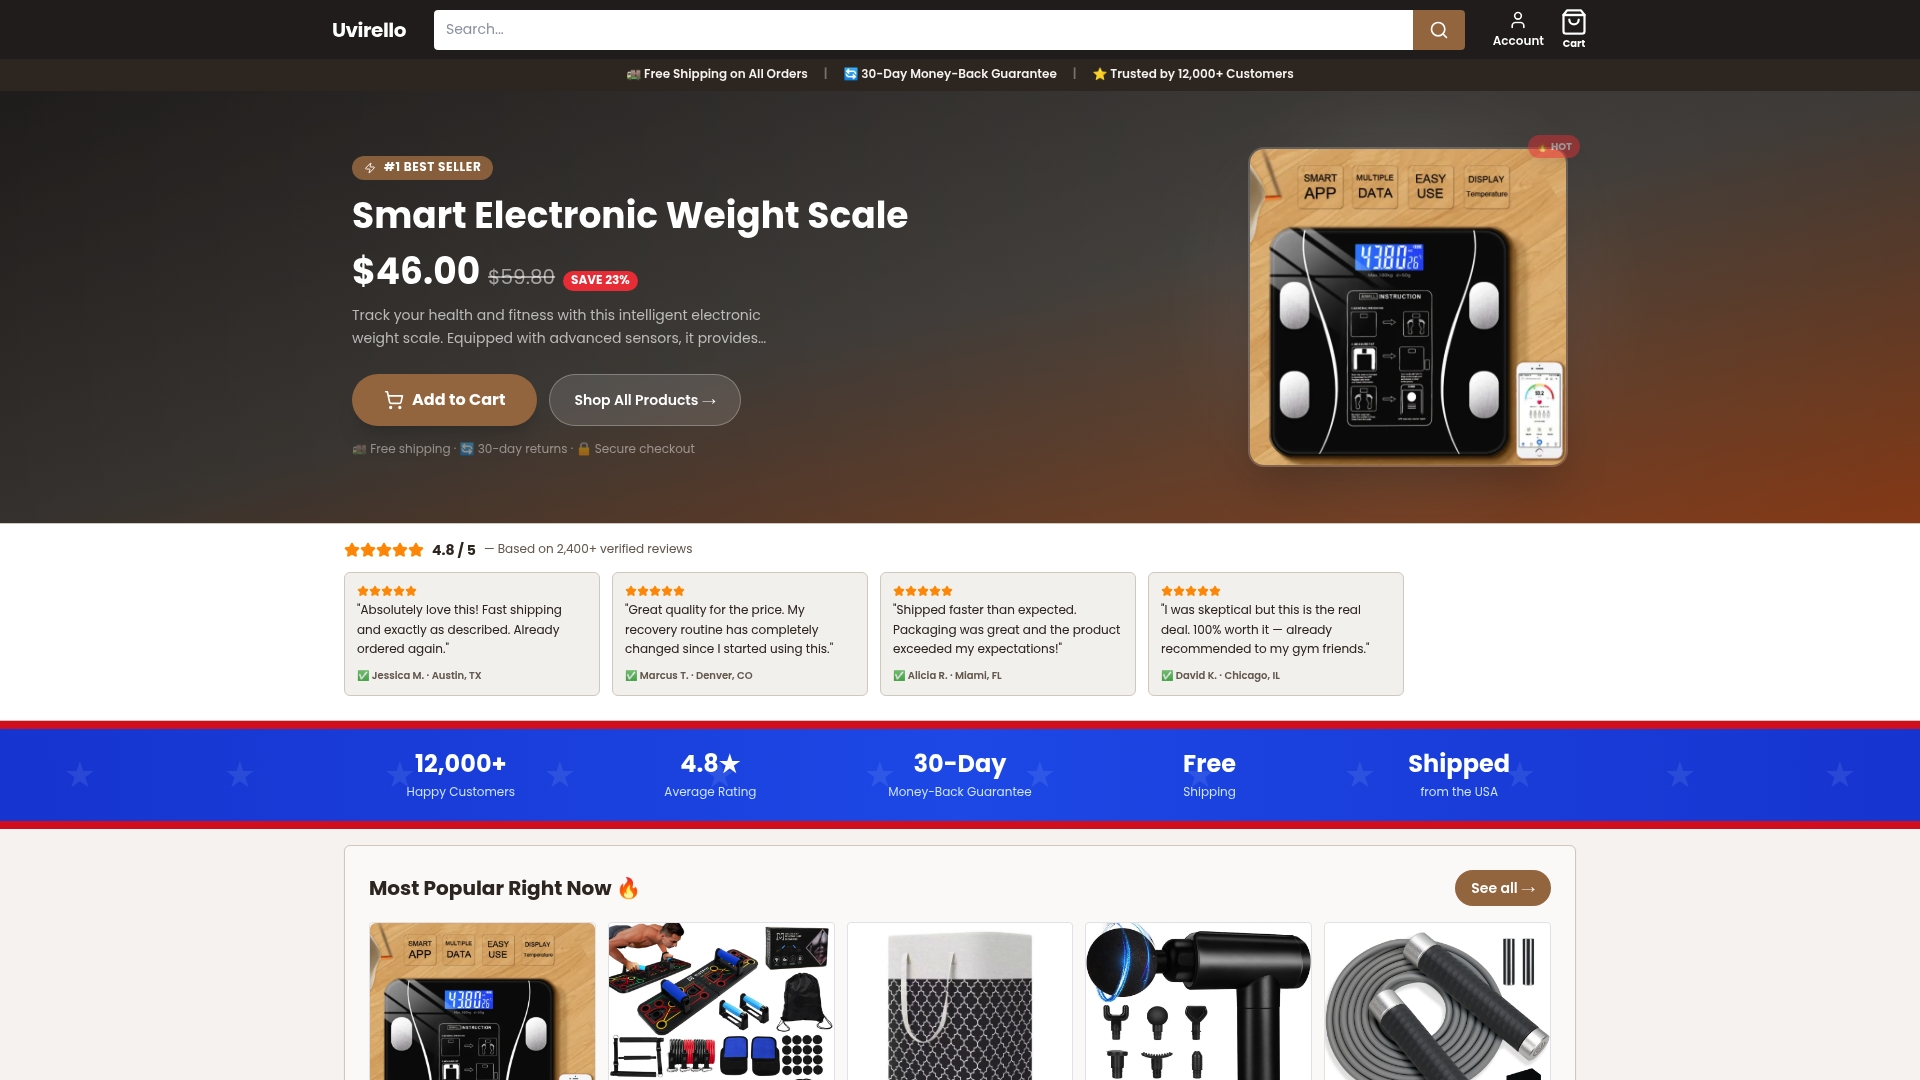
The Uvirello Smart Electronic Weight Scale was built for exactly this kind of home-based cardiometabolic screening. High-precision sensors deliver accurate weight readings and body-fat percentage estimates you can track week over week. BMI is calculated automatically. The companion app logs your trend data so you can spot a four-week pattern at a glance, and export it when you need to share it with a clinician.
Over 12,000 customers rate it 4.8 out of 5. The design is clean, the setup takes minutes, and the data it produces is the kind that actually supports the complementary-measure workflow this article describes. Before you add a blood pressure cuff and a tape measure to your morning routine, the scale is the logical first step.
Check out the Uvirello Smart Electronic Weight Scale and see how it fits your health tracking routine. For connected-device privacy questions, Uvirello's data privacy guide covers what the app collects and how it is stored.
This article is general health information, not medical advice. Confirm any clinical thresholds or screening decisions with a qualified healthcare provider.
Useful sources
The studies and resources referenced throughout this article are listed below. Sharing these with a clinician can help contextualize your home measurements.
- The Science, Strengths, and Limitations of Body Mass Index - NCBI Bookshelf
- Physiology, Body Mass Index - StatPearls - NCBI Bookshelf
- Competency in home body-fat monitoring with bioelectrical impedance devices (PMC)
- Metrologic accuracy of smart scales compared with DEXA - JMIR mHealth 2021
- Accuracy of commercial body composition scales versus DXA and BIA - ACSM-MSSE (2017)
- Are body composition scales accurate? - Houston Methodist On Health
- Body fat scale accuracy: Do they work and what do they measure? - Healthline