Consumer BIA scales measure body weight about as accurately as any digital scale on the market, but their body-fat percentage readings run into real limits. Peer-reviewed comparisons against DEXA and 4-compartment models consistently show average bias around three to four percentage points alongside wide individual-level error margins. Use BIA scale accuracy for what it's genuinely good at: tracking your own trend line over weeks and months, not producing a clinical-grade body-fat number.
TL;DR:
- BIA scales have a typical mean error of around 3 to 4 percentage points compared to DEXA, but individual results can vary widely within a 15 to 20 point range.
- Hydration levels, recent meals, exercise, posture, and device mode significantly influence daily BIA readings, often more than actual body fat changes.
- Consistent measurement conditions and averaging multiple readings over several weeks produce more reliable trend data than individual daily results.
- Clinical-grade methods like DEXA and 4-compartment models offer higher accuracy but are impractical for daily tracking and suitable mainly for medical or research purposes.
- The key to useful BIA data is to focus on long-term trends, not immediate number accuracy, and prioritize standard measurement protocols over device upgrades.
Table of Contents
- How Accurate Are BIA Scales, Really?
- What Does the Research Say About BIA vs. DEXA and 4C Accuracy?
- What Actually Moves Your Reading From Day to Day?
- Is BIA Precision Enough for Tracking Progress?
- How Do You Get More Reliable, Comparable Readings?
- When Should You Get a Clinical Body-Composition Test Instead?
- What Uvirello Wants You to Understand About Your Own Data
- What's the Bottom Line on Trusting Your Scale?
- Why the Trend Obsession Is the Right Call
- Ready to Start Tracking Your Own Trend Line?
- Sources
How Accurate Are BIA Scales, Really?
Every bioelectrical impedance scale runs a tiny, imperceptible electrical current through your body and measures how much resistance that current meets. Fat, muscle, bone, and water all conduct electricity differently, and that difference is the entire basis of the technology.
Lean tissue is mostly water and electrolytes, so it conducts current easily and shows low resistance. Fat tissue has little water content, so it resists the current more and shows higher impedance. Your scale reads that resistance value (called impedance, which combines resistance and reactance) and runs it through a mathematical formula to spit out a body-fat percentage.
That last step is where things get complicated, and where a lot of the accuracy debate actually lives.
Impedance has two components that matter:
- Resistance — how much the tissue opposes the flow of current, driven mostly by water and electrolyte content
- Reactance — the delay caused by cell membranes acting like tiny capacitors, which helps distinguish intracellular from extracellular fluid
Not all BIA devices measure this the same way. There are three broad classes worth knowing:
- Single-frequency footplate scales — the kind you'll find in most homes, sending one frequency (typically 50 kHz) through the feet only
- Multi-frequency devices — send several frequency levels through the body, which lets them separate fluid compartments (intracellular vs. extracellular water) with more nuance
- Bioelectrical impedance spectroscopy (BIS) — the most sophisticated version, scanning across a full frequency range and modeling the body's electrical behavior in more detail
Multi-frequency and BIS systems generally deliver better fluid-compartment analysis and more consistent readings than basic single-frequency footplate models, though the calibration and sensor quality of the specific unit still matter enormously — a well-made single-frequency scale can outperform a cheaply built multi-frequency one, according to a 2024 review of multi-frequency BIA performance.
Here's the part most product listings skip entirely: raw impedance numbers don't mean anything on their own. The scale converts that resistance and reactance reading into a body-fat percentage using a predictive equation, and that equation was built by comparing impedance data from a reference population against a criterion method like DEXA. If you don't resemble the population the equation was built on (in age, ethnicity, athletic status, or body shape) the estimate drifts further from your true composition. This is exactly why two scales measuring the same person can report different body-fat numbers even when both are working correctly. They're not broken. They're just running different math.
What Does the Research Say About BIA vs. DEXA and 4C Accuracy?
Peer-reviewed comparisons put consumer and clinical-grade BIA devices at a mean absolute error of roughly 3 to 4 percentage points for body-fat percentage versus DEXA, with systematic offsets that vary by brand and device type. That range sounds tight until you realize what it hides: individual results can swing far wider than the group average suggests.
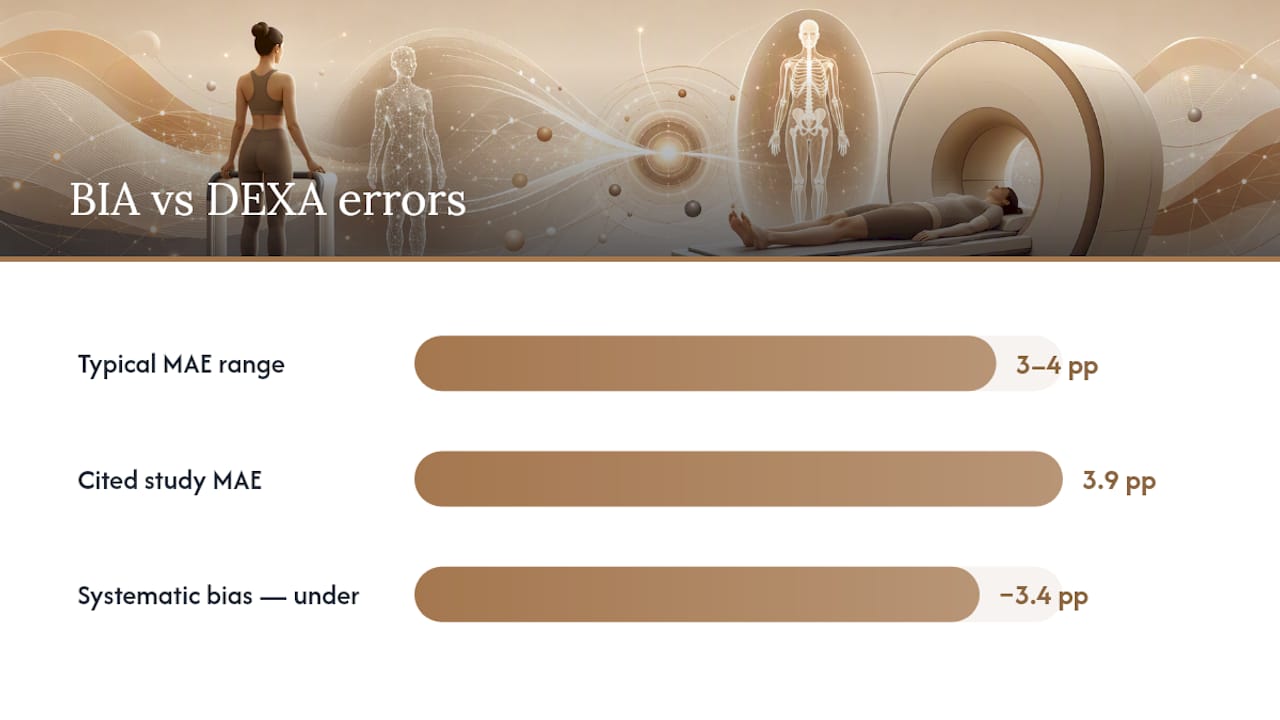
One frequently cited study of a standing InBody-style device found a mean absolute error near 3.9% for body-fat percentage, alongside a systematic −3.4% bias compared with DXA (a variant term for DEXA used in some clinical literature). In plain terms, the device tended to underestimate body fat by about three and a half points on average. What it didn't do was fix the number for any one individual. Bias correction works on populations. It doesn't work on you specifically, because your own deviation from the reference group could run in either direction, by more or less than the average.
That distinction between group-level and individual-level accuracy is crucial, and it's best explained through Bland-Altman analysis, the standard statistical method for comparing two measurement techniques.
Why "limits of agreement" matter more than average bias
Bland-Altman analysis doesn't just report whether Device A and Device B agree on average. It calculates the range within which most individual differences fall, called the limits of agreement (LoA). A small mean bias with narrow LoA means the two methods interchange well for individuals. A small mean bias with wide LoA means the opposite: the methods might match up nicely across a large group, while still being off by a lot for any single person.
That second scenario is exactly what shows up in BIA research. A systematic review comparing BIA against 4-compartment (4C) models, which is the reference-standard method combining DEXA, body volume, and total body water measurement, found mean biases across 12 studies ranging from about −3.5% to +4.4%. Those numbers look reassuringly modest. But the limits of agreement in the same review commonly spanned 15 to 20 percentage points.
| Comparison | Mean bias (%BF) | Reported MAE | Limits of agreement |
|---|---|---|---|
| Standing BIA vs. DXA | −3.4% (underestimate) | ~3.9% | Group correction improved average, not individual match |
| BIA vs. 4-compartment model (review of 12 studies) | −3.5% to +4.4% | Varies by study | ~15–20 percentage points |
| Standing BIA, supine vs. standing arrangement | Device-dependent | FM% accuracy 3.4% | ~±3–5 percentage points |
Device architecture changes these numbers too. A comparison of BIA devices in supine versus standing positions, with and without a retractable handle, found intra-unit coefficients of variation near 0.3% to 0.9% (meaning the same device gives you nearly identical readings back to back), but limits of agreement versus DXA landing around ±3 to 5 percentage points depending on the setup. The device could reproduce its own number reliably while still sitting several points away from the criterion measurement.
A notable statistic is that a review of 12 separate BIA-versus-4C studies found limits of agreement spanning roughly fifteen to twenty percentage points for body-fat percentage, even when average bias across the group looked small. That gap is the main issue behind BIA scale accuracy debates, and it's why no reputable researcher recommends using BIA for a single diagnostic reading.
Variability also shifts by population. Athletic or lean individuals tend to see larger proportional errors, because most predictive equations were built on general population samples that skew toward average body composition. Sex differences matter too, since fat distribution patterns and hydration norms differ between men and women, and equations account for this with separate formulas. People at either extreme of body-mass index, very lean or with obesity, tend to see the widest deviations from DEXA, because the relationship between impedance and fat mass becomes less linear at the edges of the range.
What Actually Moves Your Reading From Day to Day?
Hydration status is the single biggest short-term influence on a BIA reading, and it's not close. Water conducts electricity efficiently, so any shift in your fluid levels changes the impedance signal your scale interprets. A workout, a salty meal, a night of poor sleep, or an evening of alcohol can all shift your body-fat reading by several percentage points overnight, with no actual change in fat mass at all.

Timing relative to eating and exercise compounds this. A meal shifts blood flow toward digestion and add fluid to your gut. Exercise moves fluid into working muscles and can dehydrate you through sweat. Either scenario changes your impedance reading in ways that have nothing to do with fat loss or gain.
The factors that move your number the most:
- Hydration level — the dominant variable; even mild dehydration or fluid retention swings readings by multiple points
- Time since your last meal or workout — both alter blood and fluid distribution for hours afterward
- Posture and electrode contact — standing versus supine measurement, and how firmly your feet or hands contact the sensors, changes the current's path through your body
- Device mode selection — athlete mode uses a different predictive equation than the standard setting, and picking the wrong one for your actual activity level skews results
- Ambient temperature — cold feet or a cold room can increase skin resistance and distort the reading
- Device build quality — cheaper sensors and less rigorous calibration widen the gap between what you see and your true composition
Body composition extremes also introduce what researchers call proportional bias. Because most BIA prediction equations are built from general population data, people who sit outside the "average" body shape and size that trained the algorithm tend to see the equation stretch further from reality. This isn't a flaw unique to one brand. It's baked into how the statistical model works.
Posture matters considerably. Standing scales measure impedance primarily through your legs and torso, while handgrip devices add your arms into the circuit, and full BIS systems attempt to model the whole body. Switching between measurement styles, or even standing slightly differently on the same footplate scale, can change electrode contact and shift your number without any real physiological change.
Pro Tip: If your reading jumps overnight by more than a couple of points, check your water intake and sodium consumption from the day before instead of assuming your body fat actually changed. Nine times out of ten, hydration is the real story.
Is BIA Precision Enough for Tracking Progress?
Precision and accuracy answer two different questions, and mixing them up is where most people go wrong. Accuracy asks: how close is this reading to your true body-fat percentage? Precision asks: if I measure the same body five times in a row, how consistent are the results with each other?
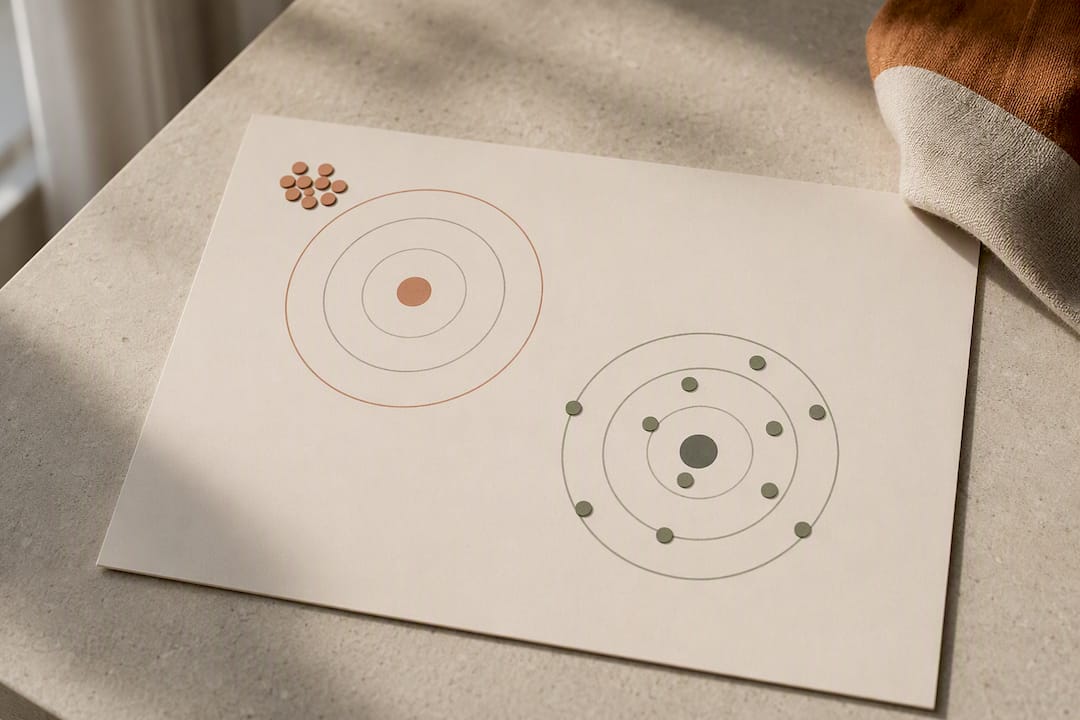
A scale can be highly precise while still being biased. Imagine a bathroom scale that always reads two pounds heavy. It's wrong every time, but it's consistently wrong, which means the change it shows you from week to week is still meaningful. That's the situation with most consumer BIA devices.
Research backs this up directly. Intra-unit precision studies have found day-to-day variation as low as 0.4% to 1.0% in absolute terms for the same consumer BIA scale measuring the same person repeatedly, even when that same device carries a multi-percentage-point bias against DEXA. In other words, the scale is remarkably good at reproducing its own number, even if that number sits a few points off from your true value.
This is the entire justification for the trend-tracking approach that runs through this article: consistency, more than absolute accuracy, is what makes a home BIA scale genuinely useful.
How to actually use that consistency:
- Judge your scale by its trend line across four to six weeks, not by any single day's reading
- Expect natural noise of a percentage point or two between consecutive days, even under identical conditions
- Treat a sudden single-day spike or drop as measurement noise until it repeats across three or more readings
- Compare readings only against your own scale's history, never against a friend's different brand or model
Standardizing your own measurement conditions is the most effective lever you have for making that trend line trustworthy, more effective than buying a pricier device. A scale with a small but stable bias, used the same way every time, will show you real fat-loss or muscle-gain trends more reliably than an expensive device used inconsistently. Pairing consistent measurement with app-connected tracking that visualizes your data over time makes that multi-week signal much easier to actually see.
How Do You Get More Reliable, Comparable Readings?
A standardized protocol removes most of the noise that makes BIA readings look erratic, and it takes about two minutes of discipline each morning.
- Weigh yourself first thing in the morning, fasted, and after using the bathroom. This is the most stable physiological state your body reaches each day, before food, fluid, or activity introduce variables.
- Use the same scale, on the same flooring, every time. Switching between a tile floor and a carpeted one, or between two different scales, changes electrode contact and introduces variation that has nothing to do with your body.
- Log in under the same profile or account each time. Most smart scales store your age, sex, and height to run the correct predictive equation, and mixing up profiles skews the math.
- Skip the measurement after alcohol, a sauna session, or an intense workout within the past 12 to 24 hours. Each of these disrupts hydration status enough to throw off the reading meaningfully.
- Select the correct device mode for your actual training status. Athlete mode assumes a different body-water distribution than the standard setting, and using the wrong one for your real activity level introduces avoidable error.
- Take three consecutive morning readings and average them, rather than trusting any single measurement, since averaging multiple readings reduces random day-to-day variance and makes real multi-week change easier to detect.
- Write down context notes (poor sleep, a salty dinner, travel) next to unusual readings, so you can explain outliers later instead of second-guessing your progress.
| Protocol step | Why it matters | Common mistake |
|---|---|---|
| Morning, fasted, post-bathroom | Most stable hydration state of the day | Weighing at random times |
| Same scale and surface | Keeps electrode contact and calibration consistent | Switching scales or flooring |
| Correct device mode | Uses the matching predictive equation | Leaving it on the default setting regardless of activity level |
| Average 3 mornings | Cancels out random daily noise | Reacting to a single day's number |
If you travel often, keeping this protocol intact gets harder, and it's worth knowing what tools actually travel well without wrecking your data continuity. If hydration swings are throwing you off at home, understanding how water retention masquerades as fat gain will save you a lot of unnecessary worry.
When Should You Get a Clinical Body-Composition Test Instead?
DEXA, 4-compartment models, hydrostatic weighing, and the Bod Pod all sit closer to the gold standard than any home scale, but each comes with real trade-offs in cost, access, and convenience that make daily use impractical for almost everyone.
DEXA (dual-energy X-ray absorptiometry) is the most accessible clinical-grade option, typically carrying error margins in the range of 1% to 3% for body-fat percentage. It requires a scan at a clinic, imaging center, or specialized fitness facility, usually costing somewhere between $50 and $150 per session depending on your region, plus a small dose of radiation exposure (minimal, but a real consideration for frequent testing).
The 4-compartment model is the actual research gold standard, combining DEXA-derived bone data with body volume measurement and total body water testing. It's the method other techniques get validated against, but it's essentially confined to research settings due to the equipment and time required. You won't find this available for casual personal use.
Hydrostatic (underwater) weighing calculates body density by measuring how much water you displace when fully submerged, then converts that density into a fat percentage using established formulas. It's accurate but logistically demanding. You need a specialized tank, a technician, and a willingness to exhale completely underwater, which rules it out for routine tracking.
The Bod Pod uses air displacement instead of water, sitting inside an egg-shaped chamber that measures how much air your body displaces. It's faster and more comfortable than hydrostatic weighing with comparable accuracy, but it's still limited to university labs, some sports performance centers, and select medical facilities.
When a clinical test is actually worth the cost and hassle:
- A doctor needs an accurate body-composition number for a genuine medical decision, not general curiosity
- You're being evaluated for sports team selection or a weight-class competition with a hard cutoff
- You're participating in a research study that requires criterion-level measurement
- You want a periodic reality check, once or twice a year, against your home tracking trend
For everyone else asking how accurate BIA scales are for daily use, the honest answer is that home tracking and clinical testing serve different jobs entirely. One tells you where you stand on a given day with real precision. The other tells you whether the direction you're heading over weeks and months is the one you want, and that second question is the one most people actually need answered.
What Uvirello Wants You to Understand About Your Own Data
Reliable body-composition tracking depends less on the specific device you own and more on how consistently you use it. That's the guidance running through every section of this article, and it's worth restating plainly here: a smart scale's real value comes from watching your own trend line, not from treating any single reading as a lab result.
Some smart scales are built around that principle. High-precision sensors and validated algorithms can reduce the noise that comes from cheap hardware, and a sleek, straightforward interface can make the daily habit of standardized measurement genuinely easy to stick with, which matters more for data quality than most people assume.
A body-fat percentage from any consumer scale, ours included, is an estimate built on a population-average formula. It will drift from a clinical measurement for some individuals. What it will do reliably, when you standardize how you use it, is show you the direction your body is actually moving.
If a number ever looks alarming or contradicts how you feel physically, that's a conversation for a doctor or a clinical-grade test, not a reason to distrust every reading you've logged. Uvirello's guidance on reading body-water changes is a good next stop for readers who want to separate real fat trends from ordinary fluid noise.
What's the Bottom Line on Trusting Your Scale?
Use BIA scale accuracy for what the evidence actually supports: a consistent, repeatable trend signal, not a lab-grade diagnosis. The research is unambiguous on this point. Group-level bias can look small while individual-level error stays wide, so the smartest move is judging your body composition by the slope of your data, not any single Tuesday morning reading.
Your immediate checklist:
- Follow a standardized protocol: same time, same scale, same conditions, every measurement
- Average three consecutive morning readings instead of reacting to one
- Track the four-to-six-week trend line, not day-to-day fluctuation
- Reserve DEXA or another clinical test for genuine medical decisions, not routine curiosity
- Expect readings to vary between brands and devices, and stop comparing your number to anyone else's
Getting more out of your data from here mostly means using it differently, not buying a different scale. Turning composition trends into actual training and nutrition decisions is the next logical step once your measurement routine is locked in, and understanding why composition tracking beats chasing the scale number alone will change how you read your own progress going forward.
Why the Trend Obsession Is the Right Call
The conventional advice on this topic usually stalls at "BIA scales aren't perfectly accurate, so be skeptical." That's technically true and practically useless. The research actually supports something more specific: the bias is often consistent enough, and the precision high enough, that the number you should distrust is any single reading, not the device itself.
Where most advice falls short is treating accuracy and precision as the same conversation. They're not. A scale that's reliably off by three points is still a legitimate tool if you're using it to spot a five-point change over two months. The mistake isn't owning a BIA scale. It's checking it once, panicking or celebrating, and never establishing the baseline that makes the data mean anything.
Prioritize the protocol before the product. Standardized timing and conditions will improve your data quality more than upgrading to a pricier device with the same footplate design. Get the routine right first, then let the trend line, not the daily number, tell you the real story.
— Jacob
Ready to Start Tracking Your Own Trend Line?
Everything in this article points to the same practical conclusion: the scale matters less than the routine, but a well-built scale makes that routine easier to stick with. Uvirello's Smart Electronic Weight Scale is designed around that reality, with high-precision sensors, a clean app-connected interface, and consistent day-to-day readings that reward a standardized measurement habit rather than punishing an inconsistent one.
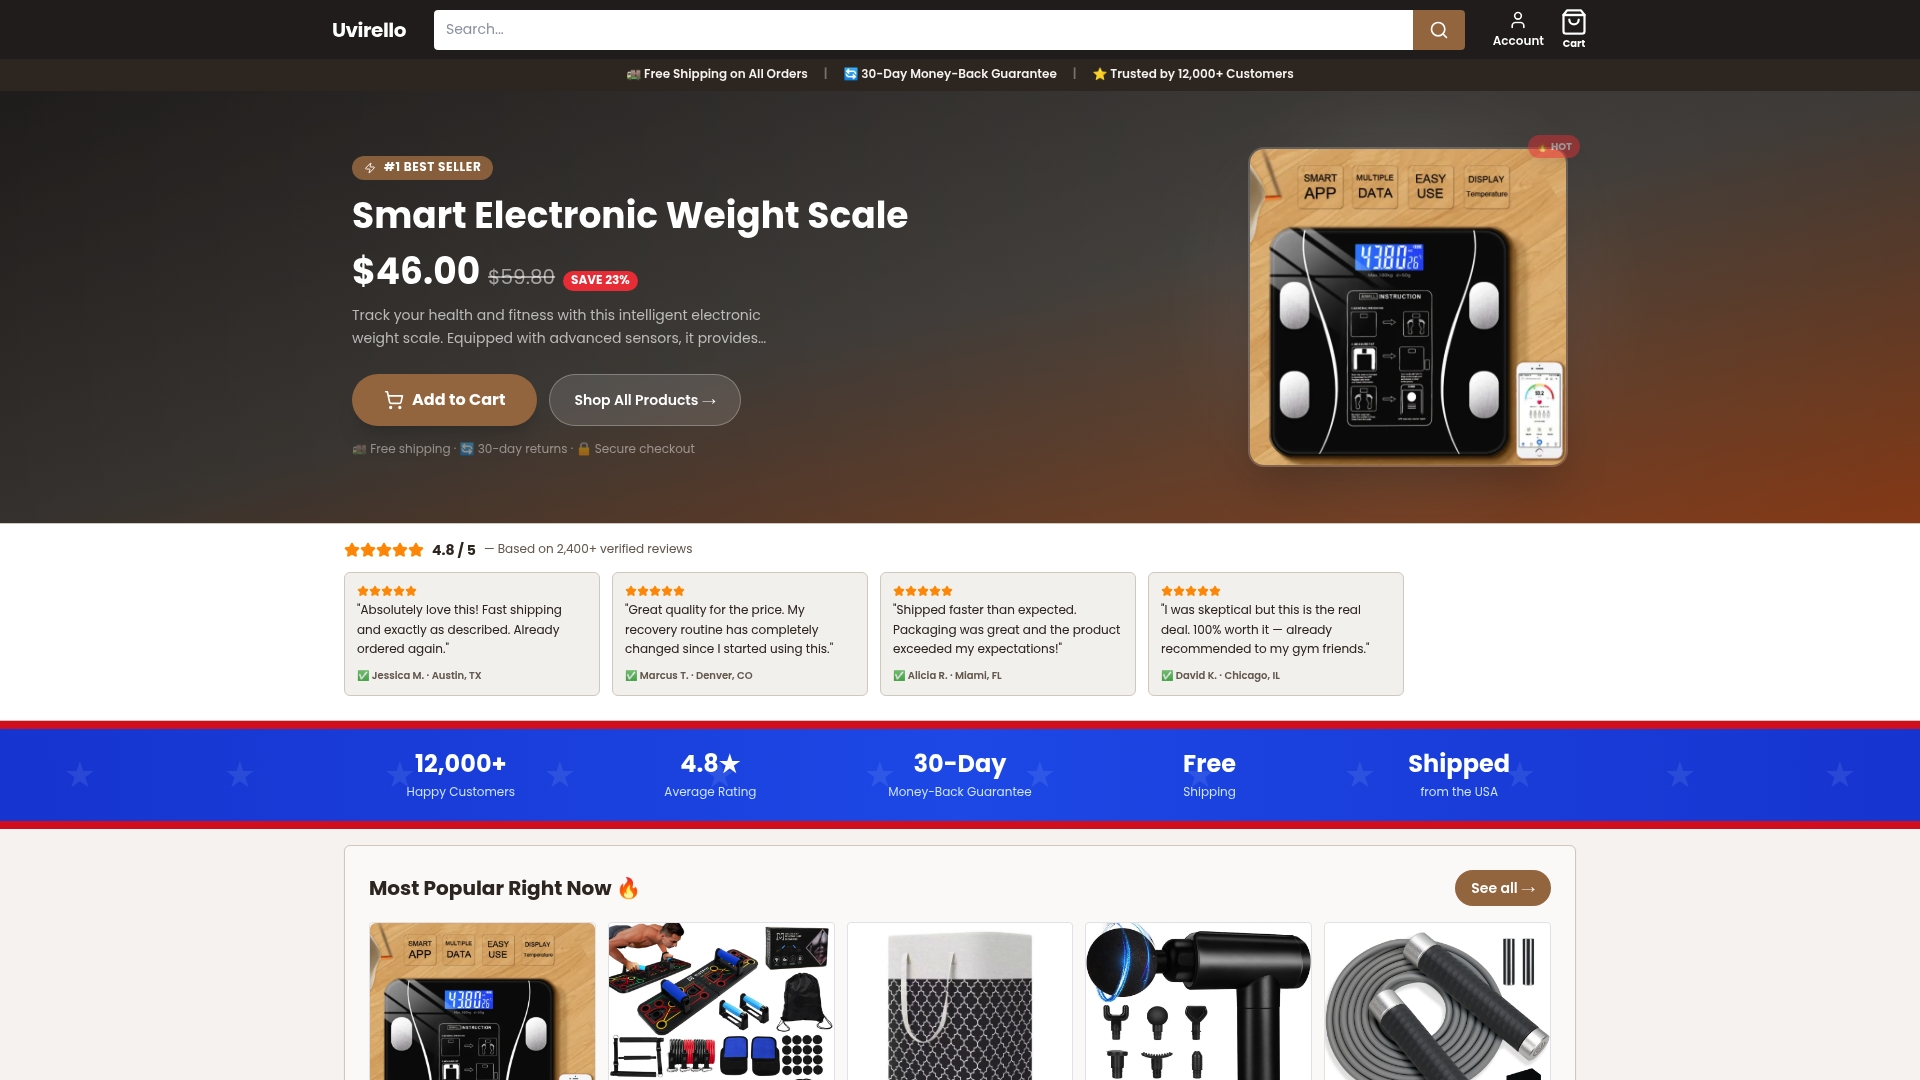
It suits anyone who wants more than a weight number: fitness enthusiasts building a training log, people managing a weight-loss plan who need an honest trend line, and home-gym owners who want body composition data without a clinic visit. If you've read this far, you already understand the protocol that makes any BIA scale worth trusting. Pair that discipline with a device built for consistent daily use, and check out the Uvirello Smart Electronic Weight Scale to start your own standardized tracking routine this week.
This article is general information, not a substitute for advice from a qualified doctor. Consult a qualified healthcare professional about your own circumstances before acting on anything here.